| (1) | (2) | |
|---|---|---|
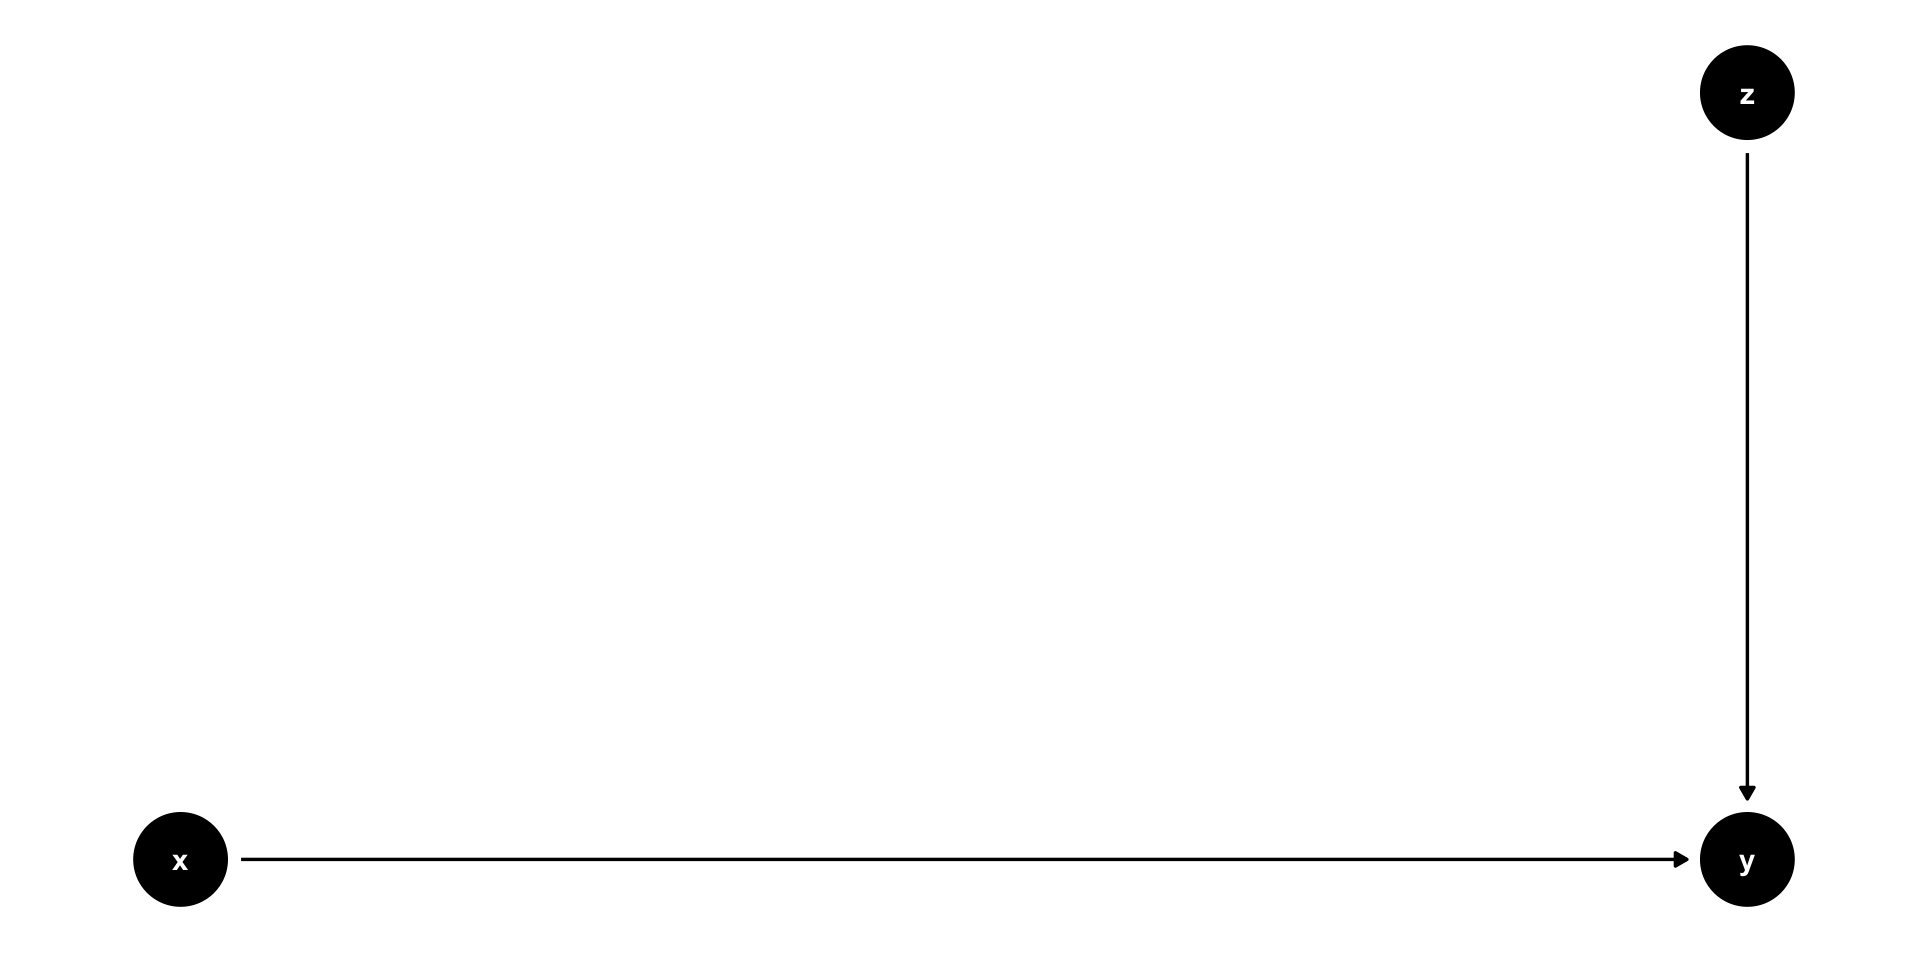
| (Intercept) | 0.006 | 0.005 |
| (0.012) | (0.010) | |
| x | 1.501 | 0.995 |
| (0.009) | (0.010) | |
| z | 0.999 | |
| (0.014) | ||
| Num.Obs. | 10000 | 10000 |
| R2 | 0.752 | 0.835 |
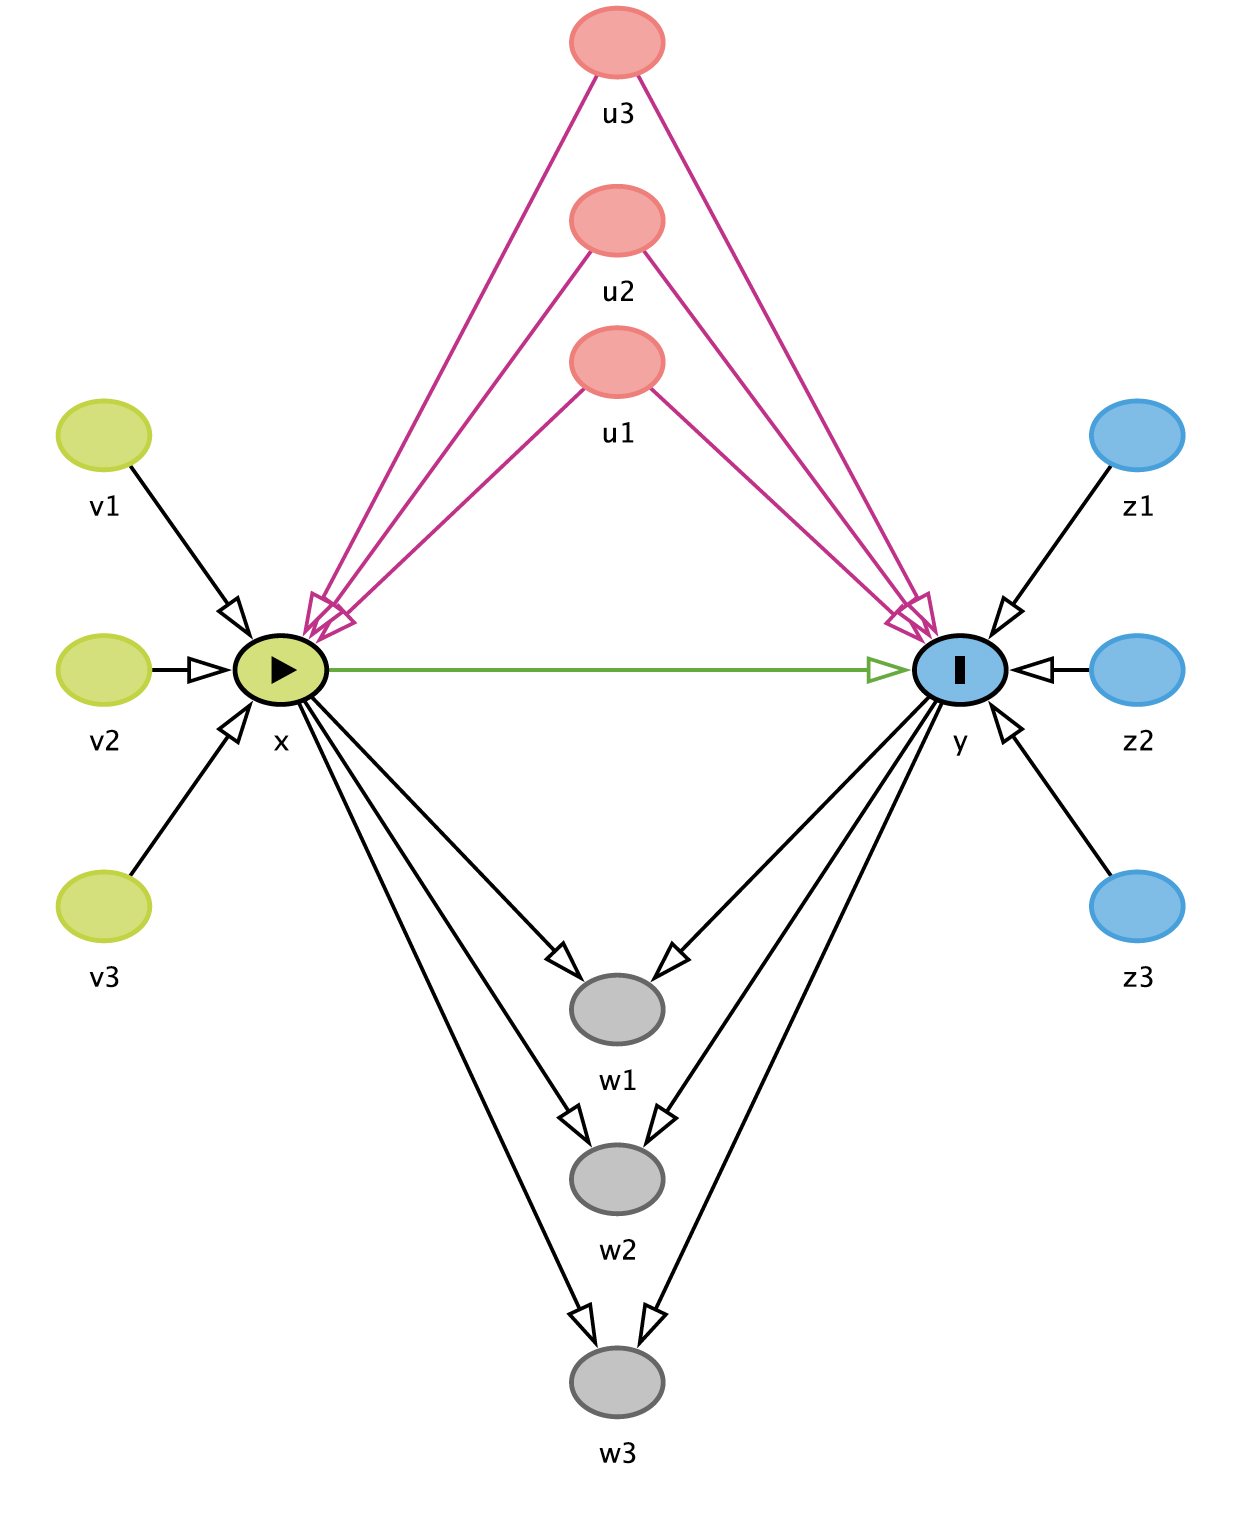
what to control
Crash Course in Good and Bad Controls: Linear (R)
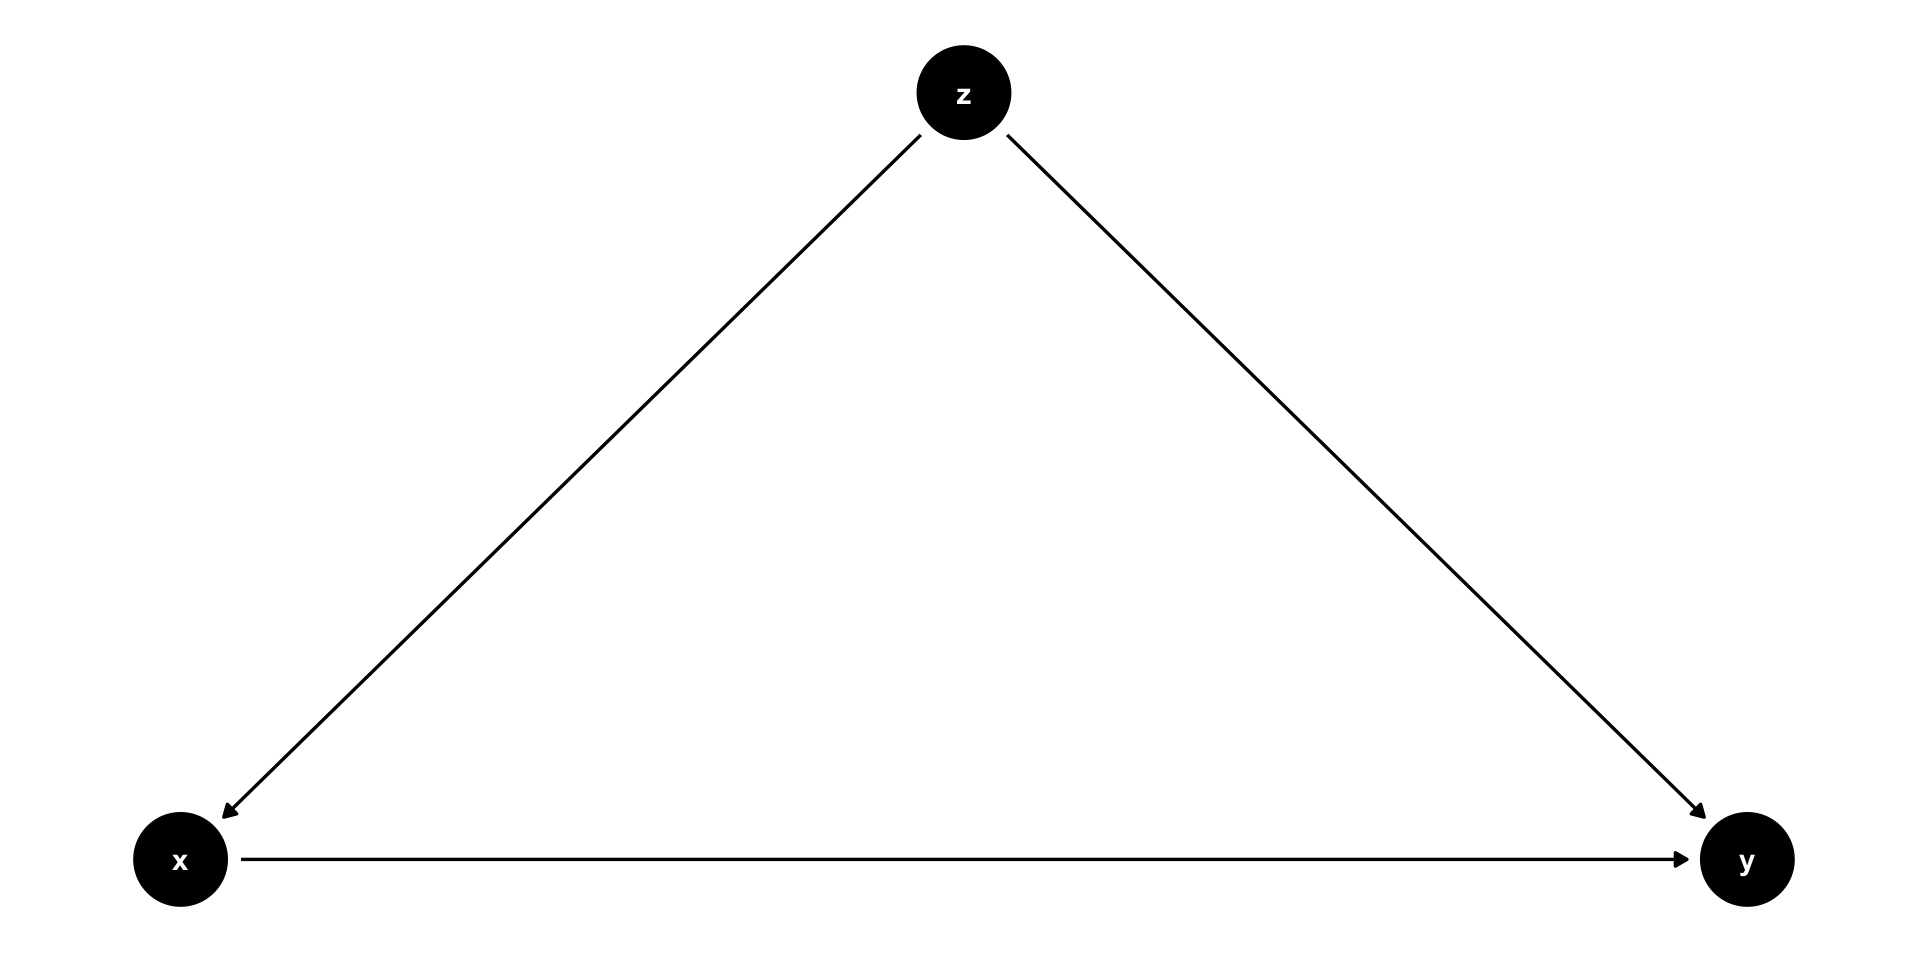
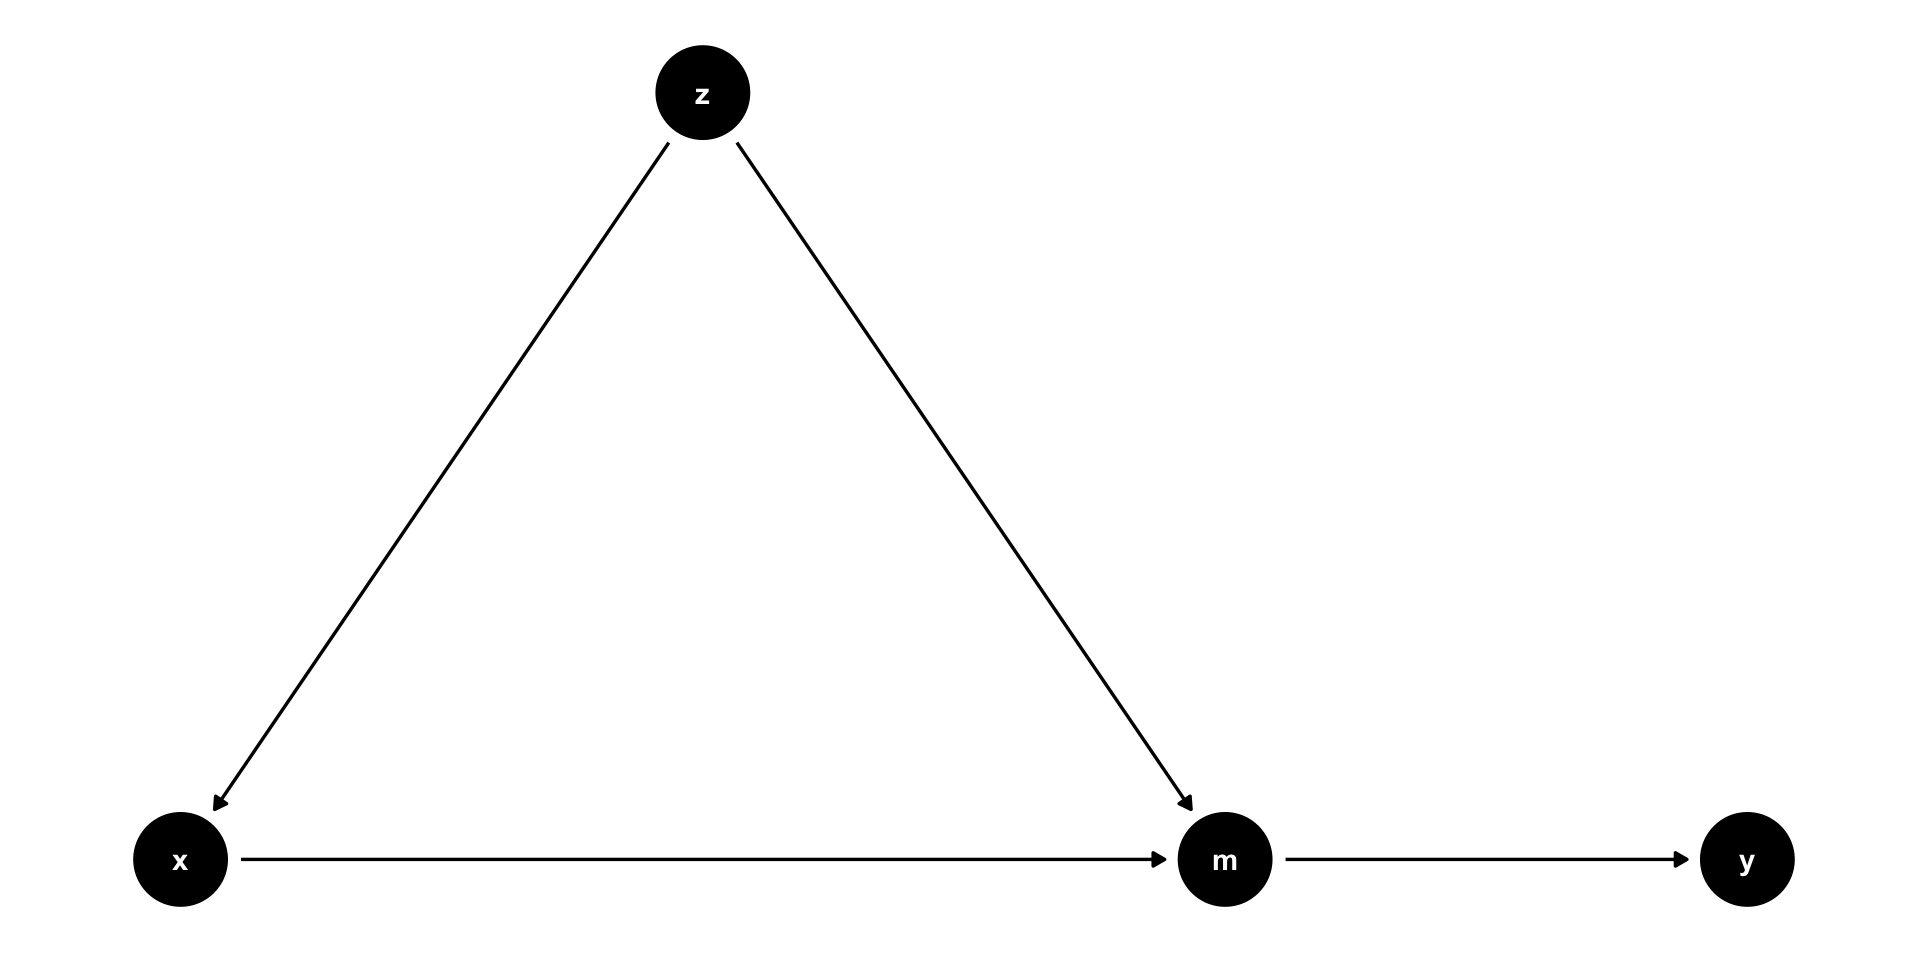
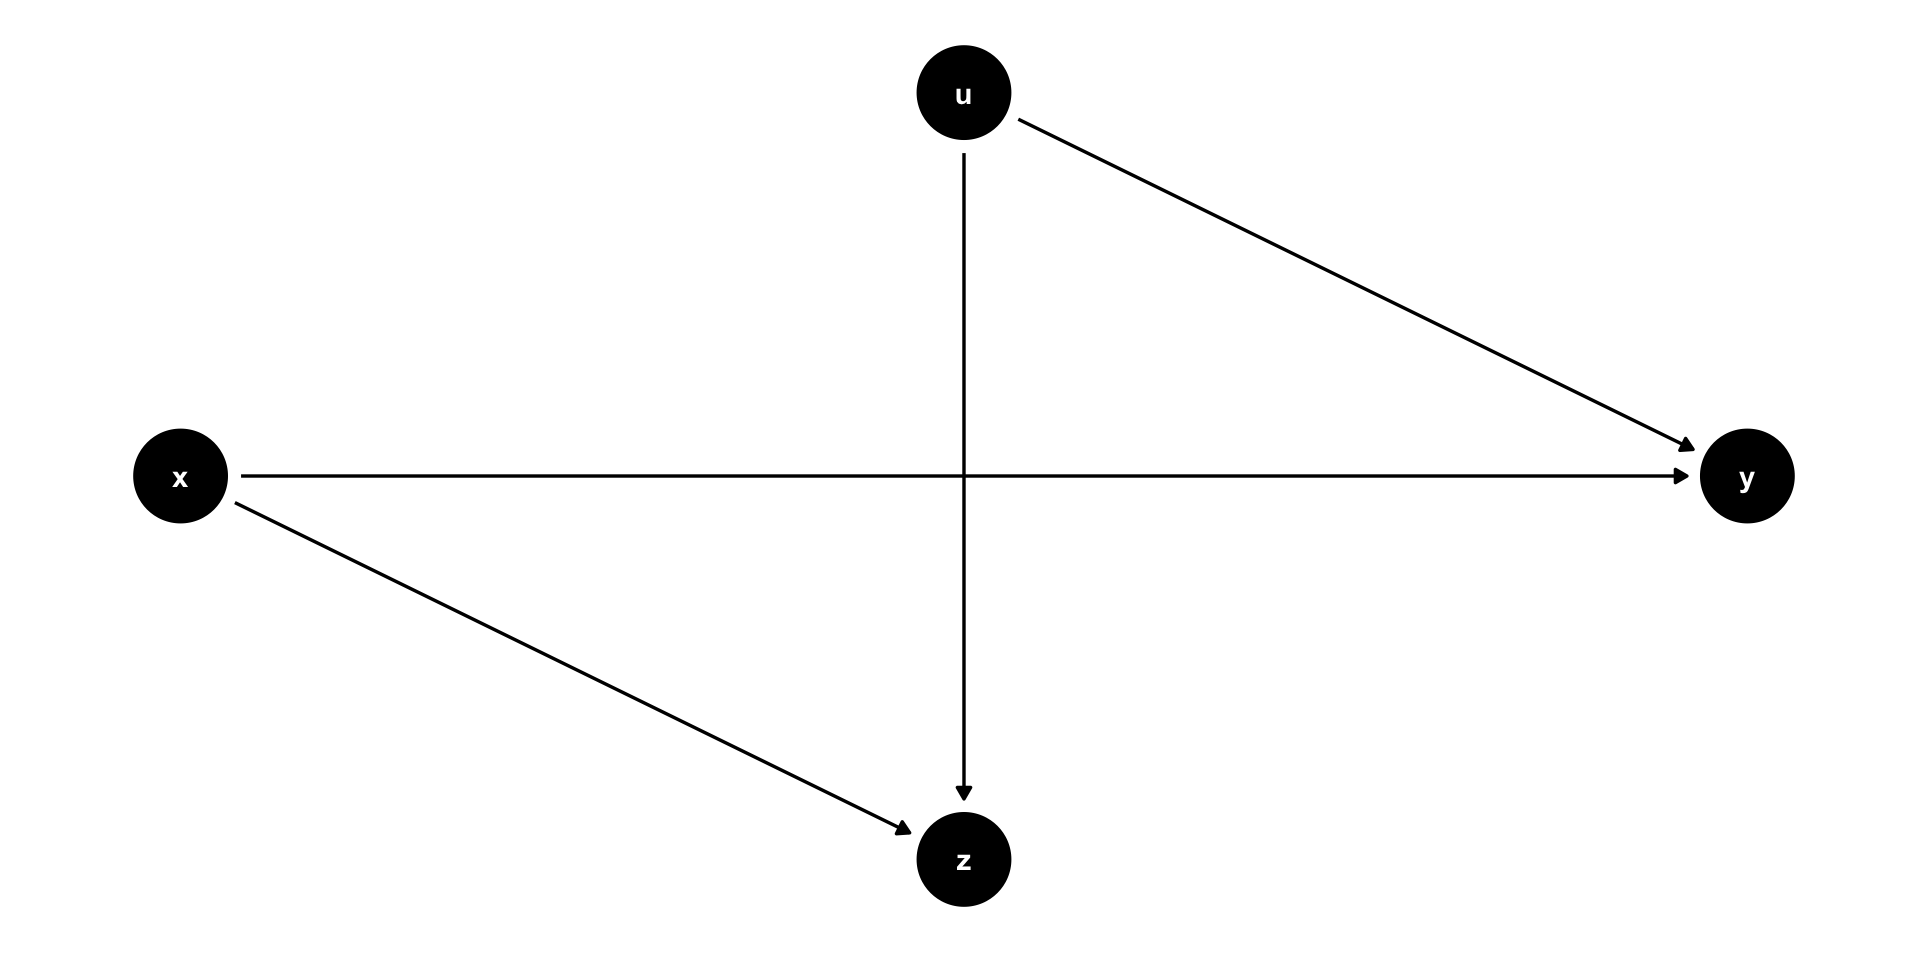
model1 graph
model1 simulation
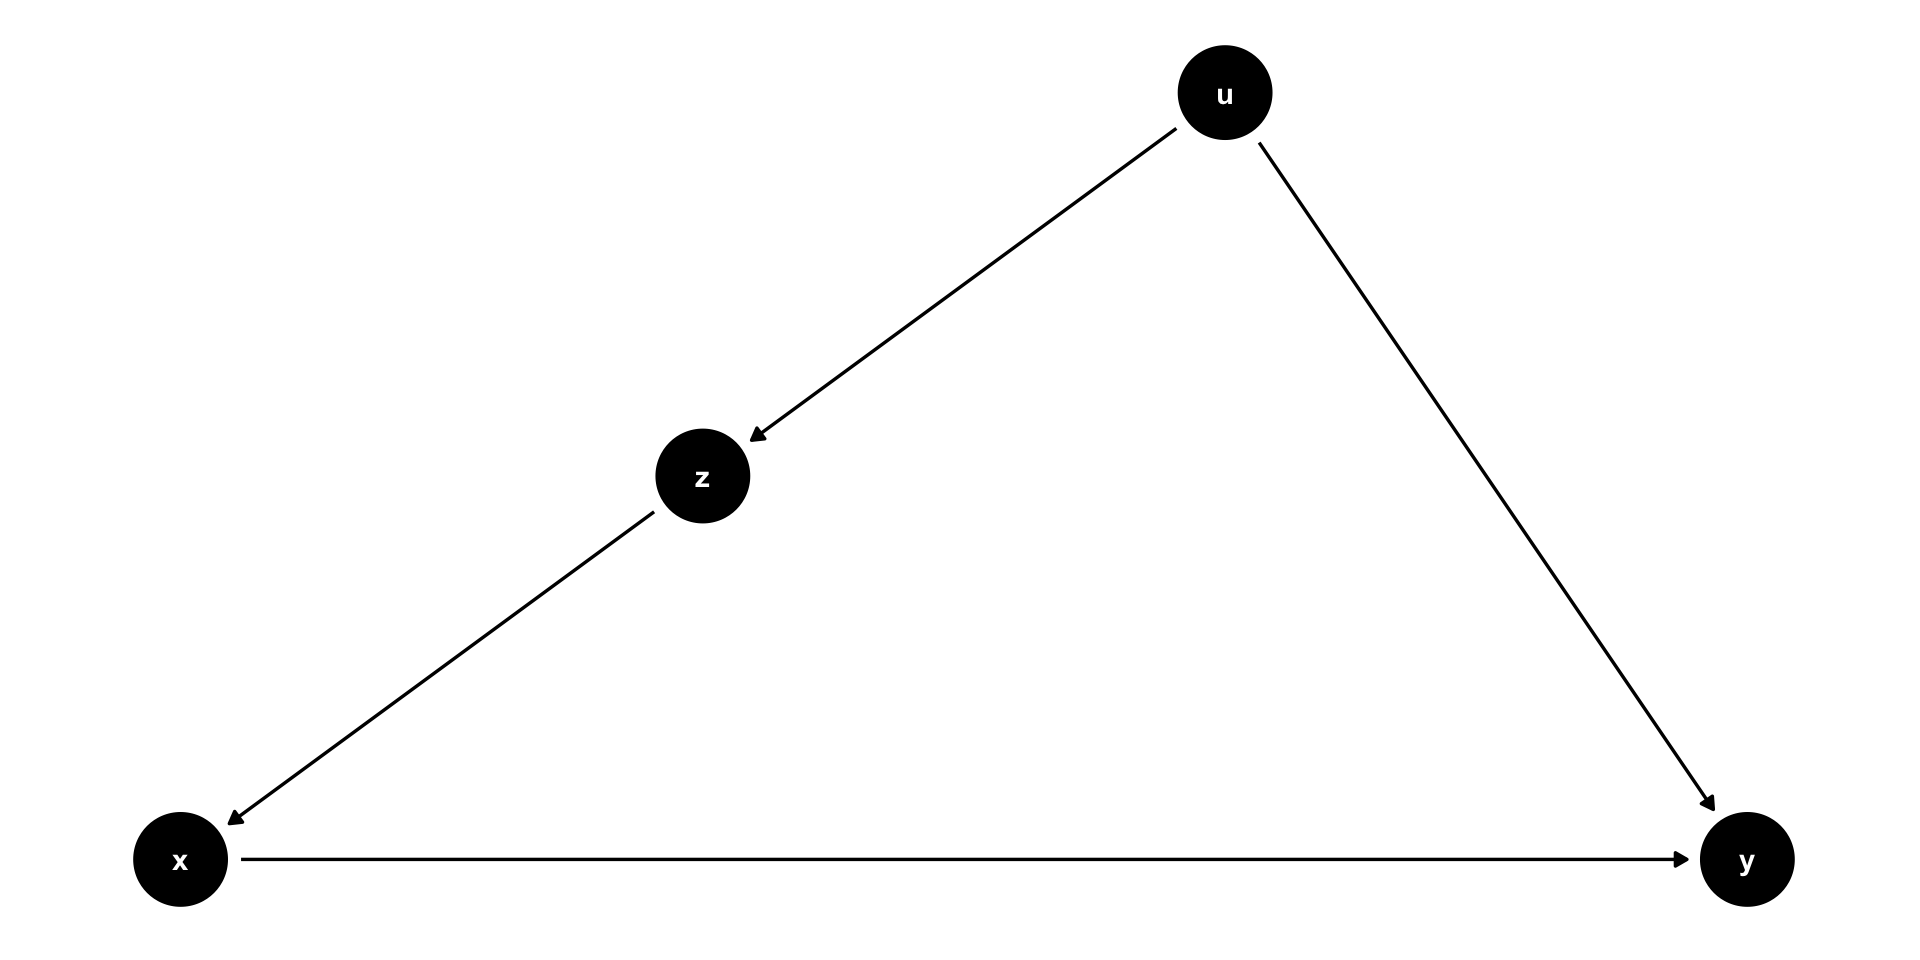
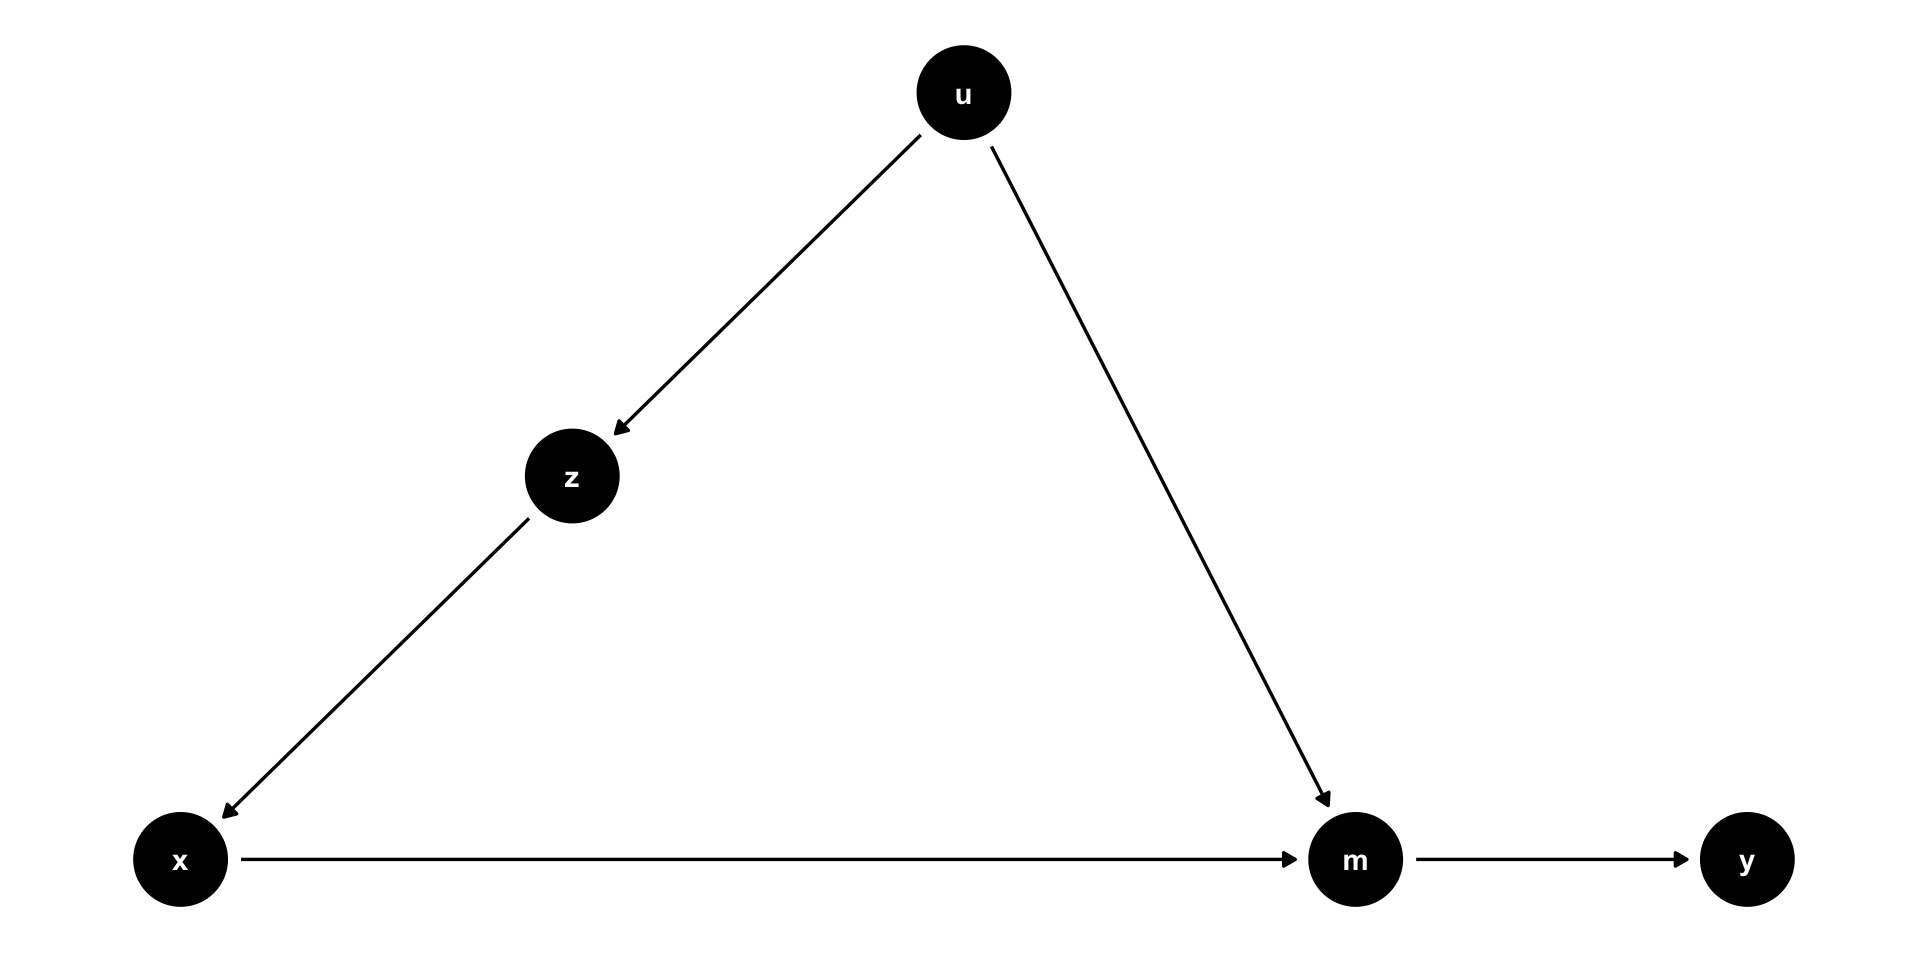
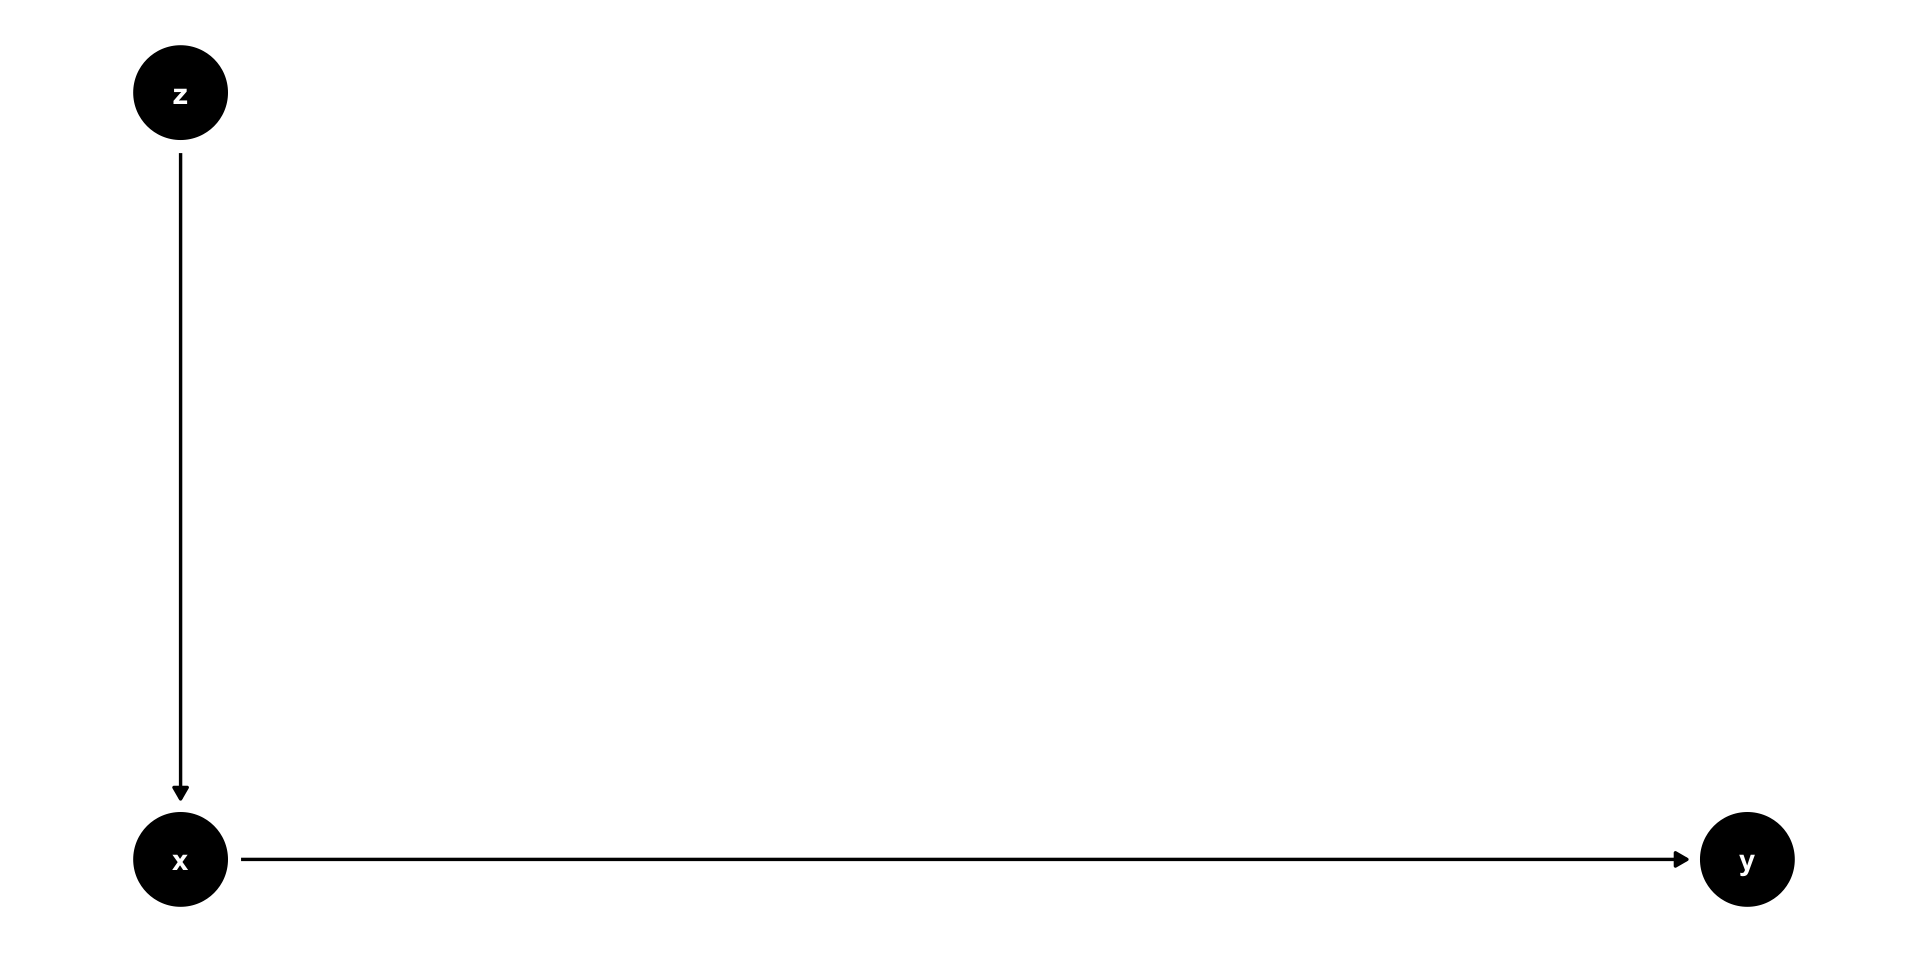
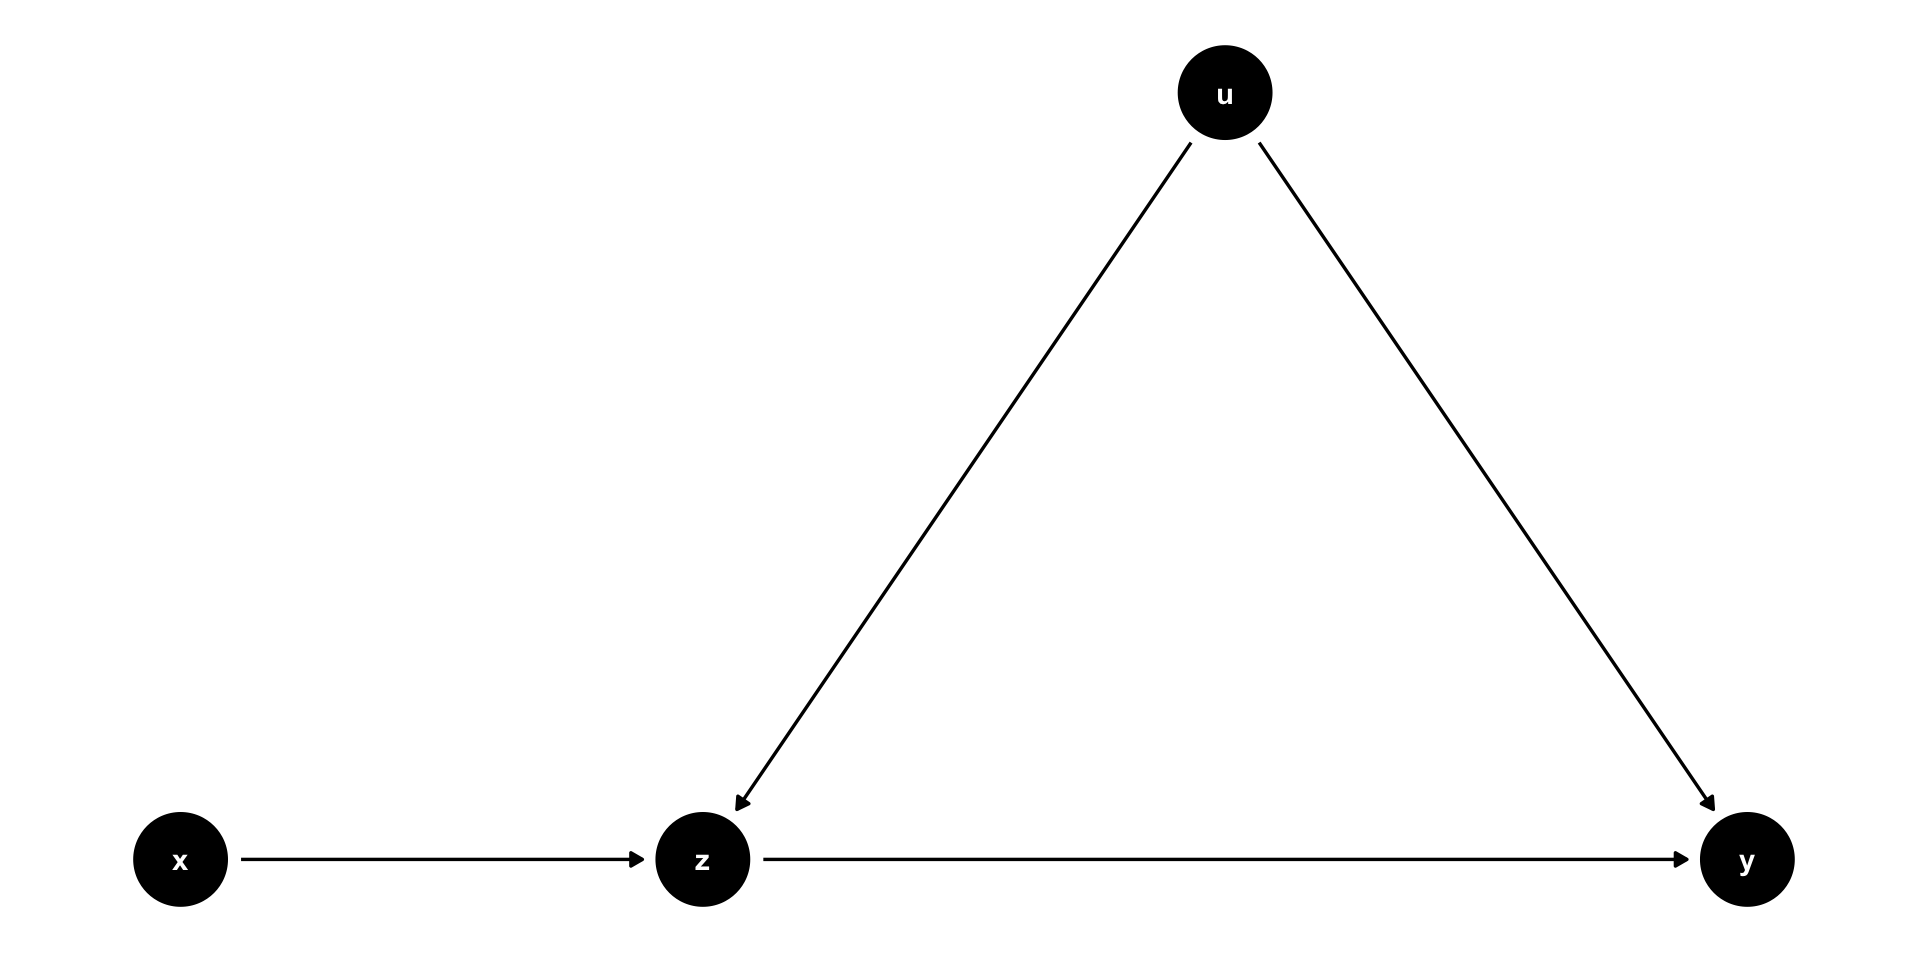
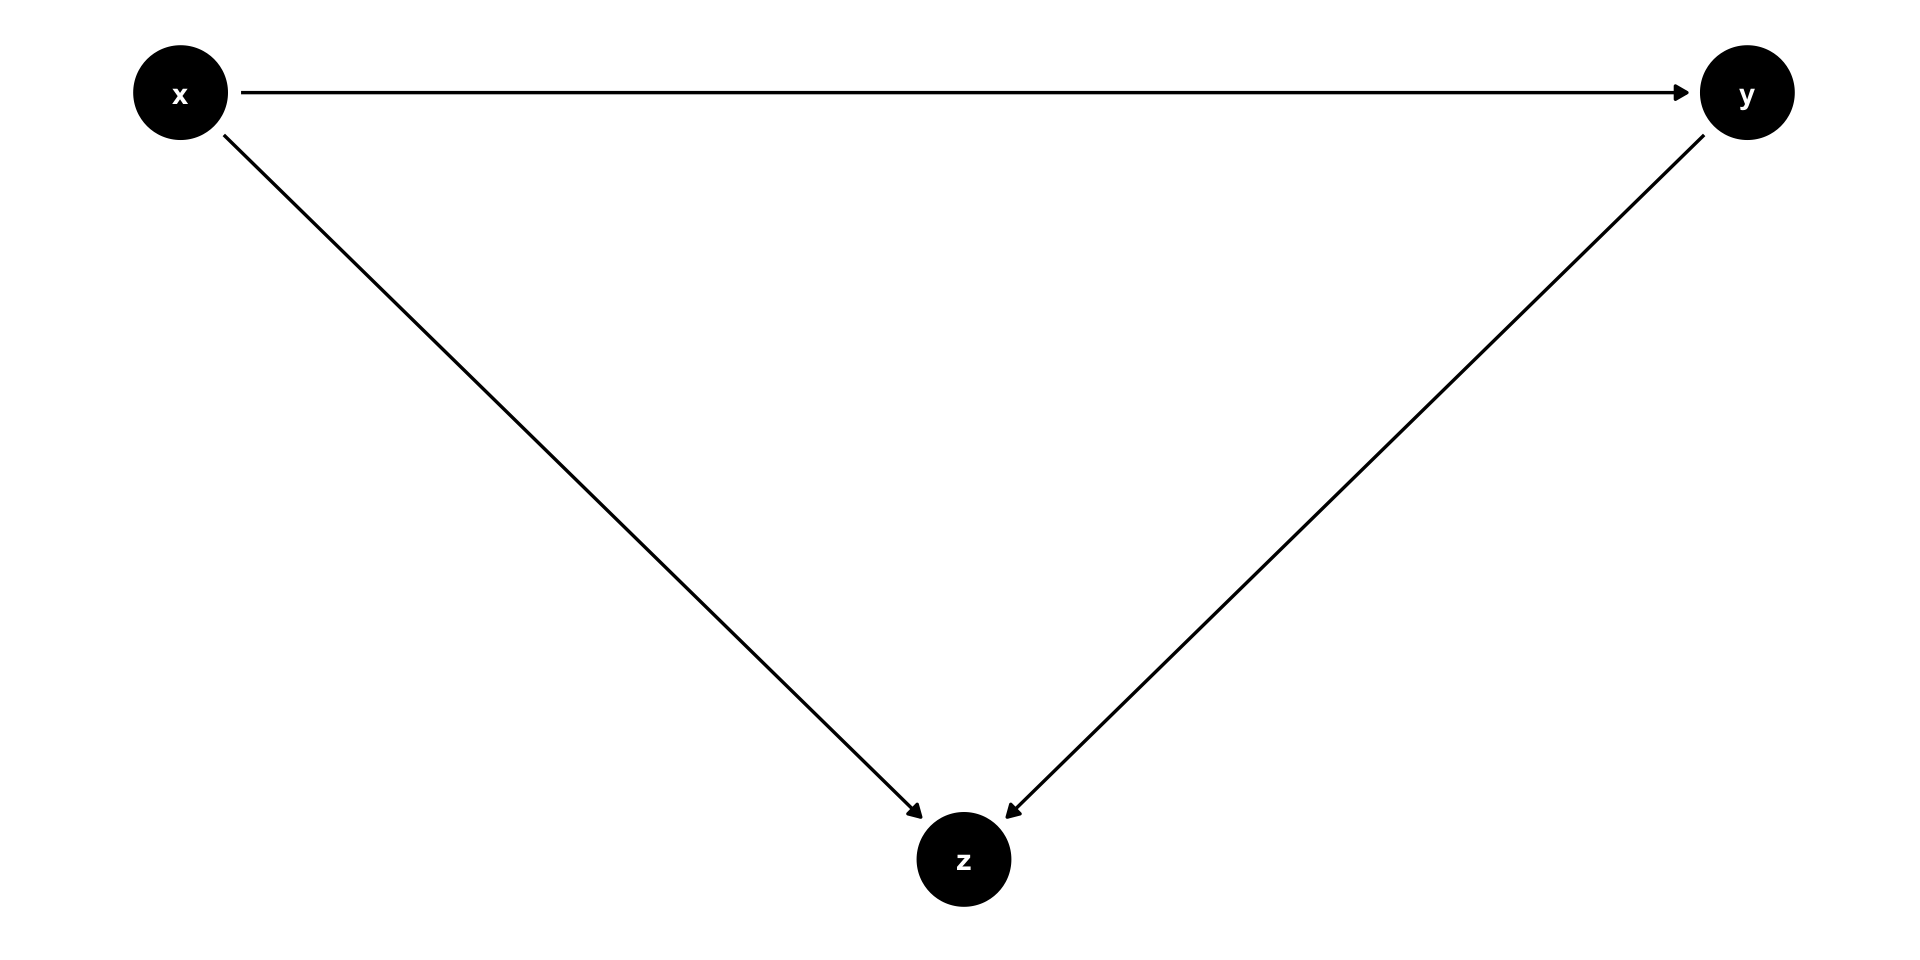
model2 graph
model2 simulation
| (1) | (2) | |
|---|---|---|
| (Intercept) | 0.001 | 0.005 |
| (0.013) | (0.012) | |
| x | 1.341 | 0.991 |
| (0.008) | (0.012) | |
| z | 0.527 | |
| (0.015) | ||
| Num.Obs. | 10000 | 10000 |
| R2 | 0.760 | 0.786 |
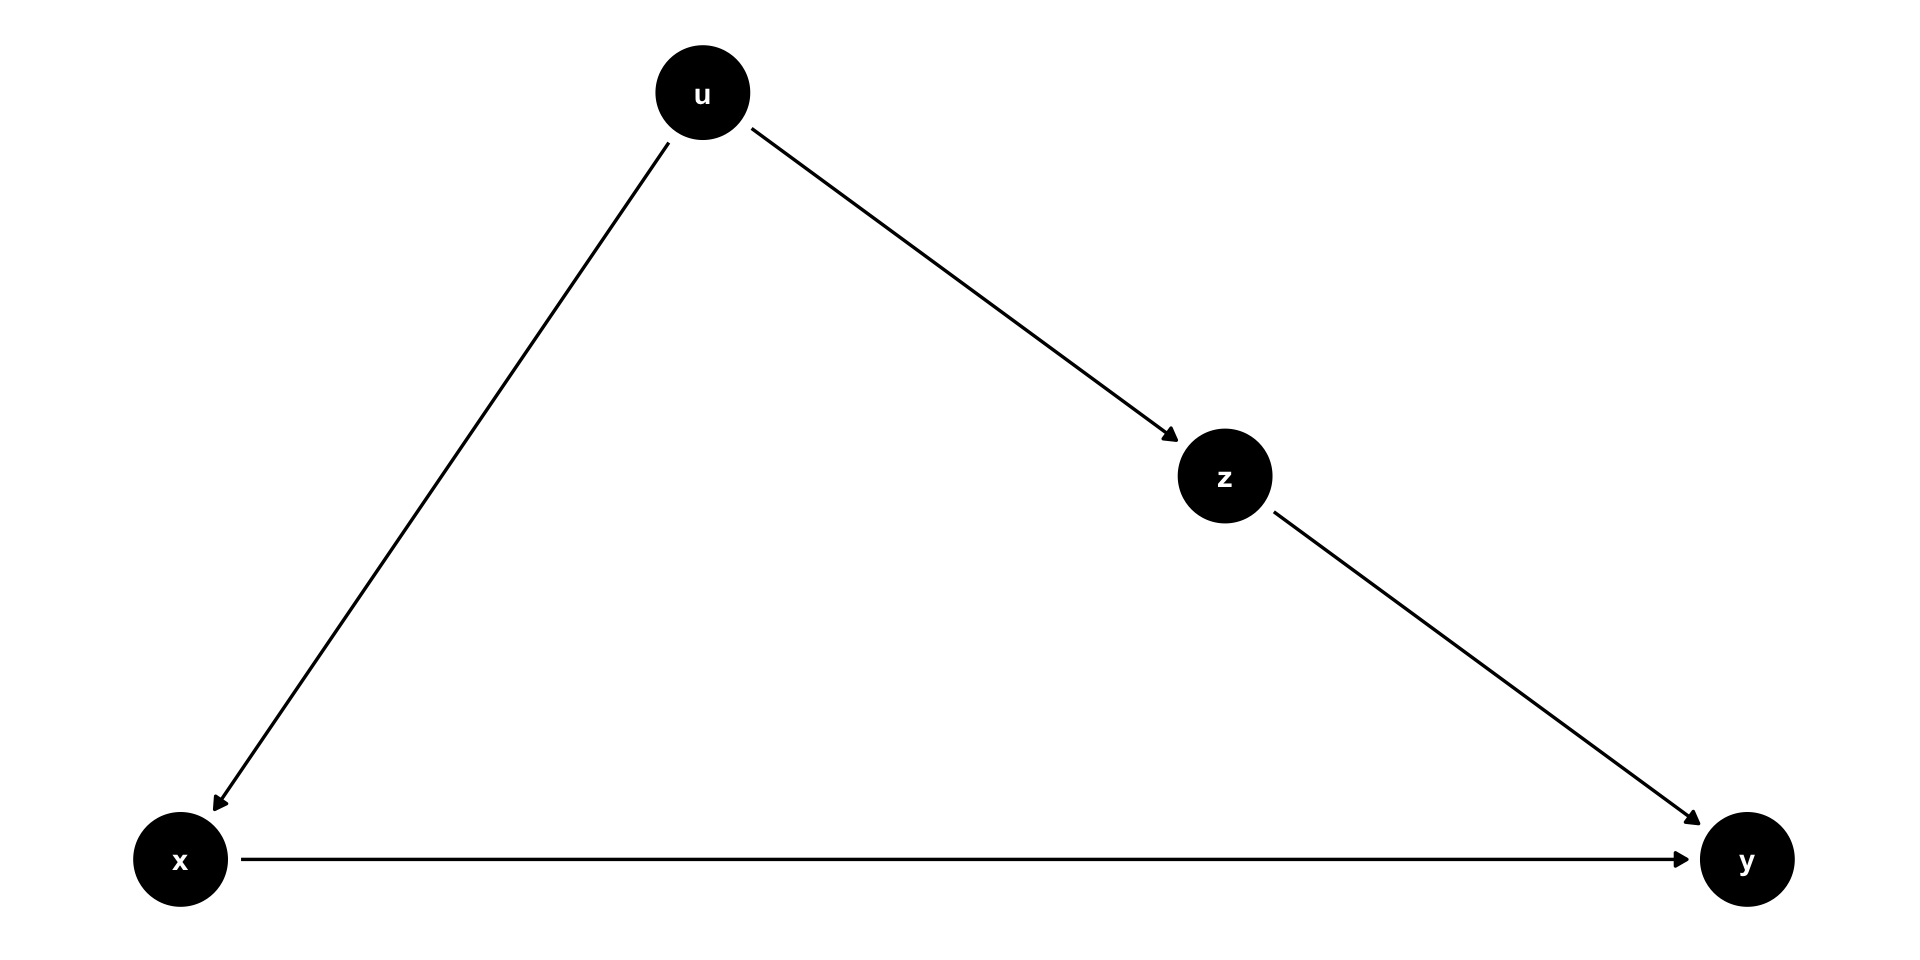
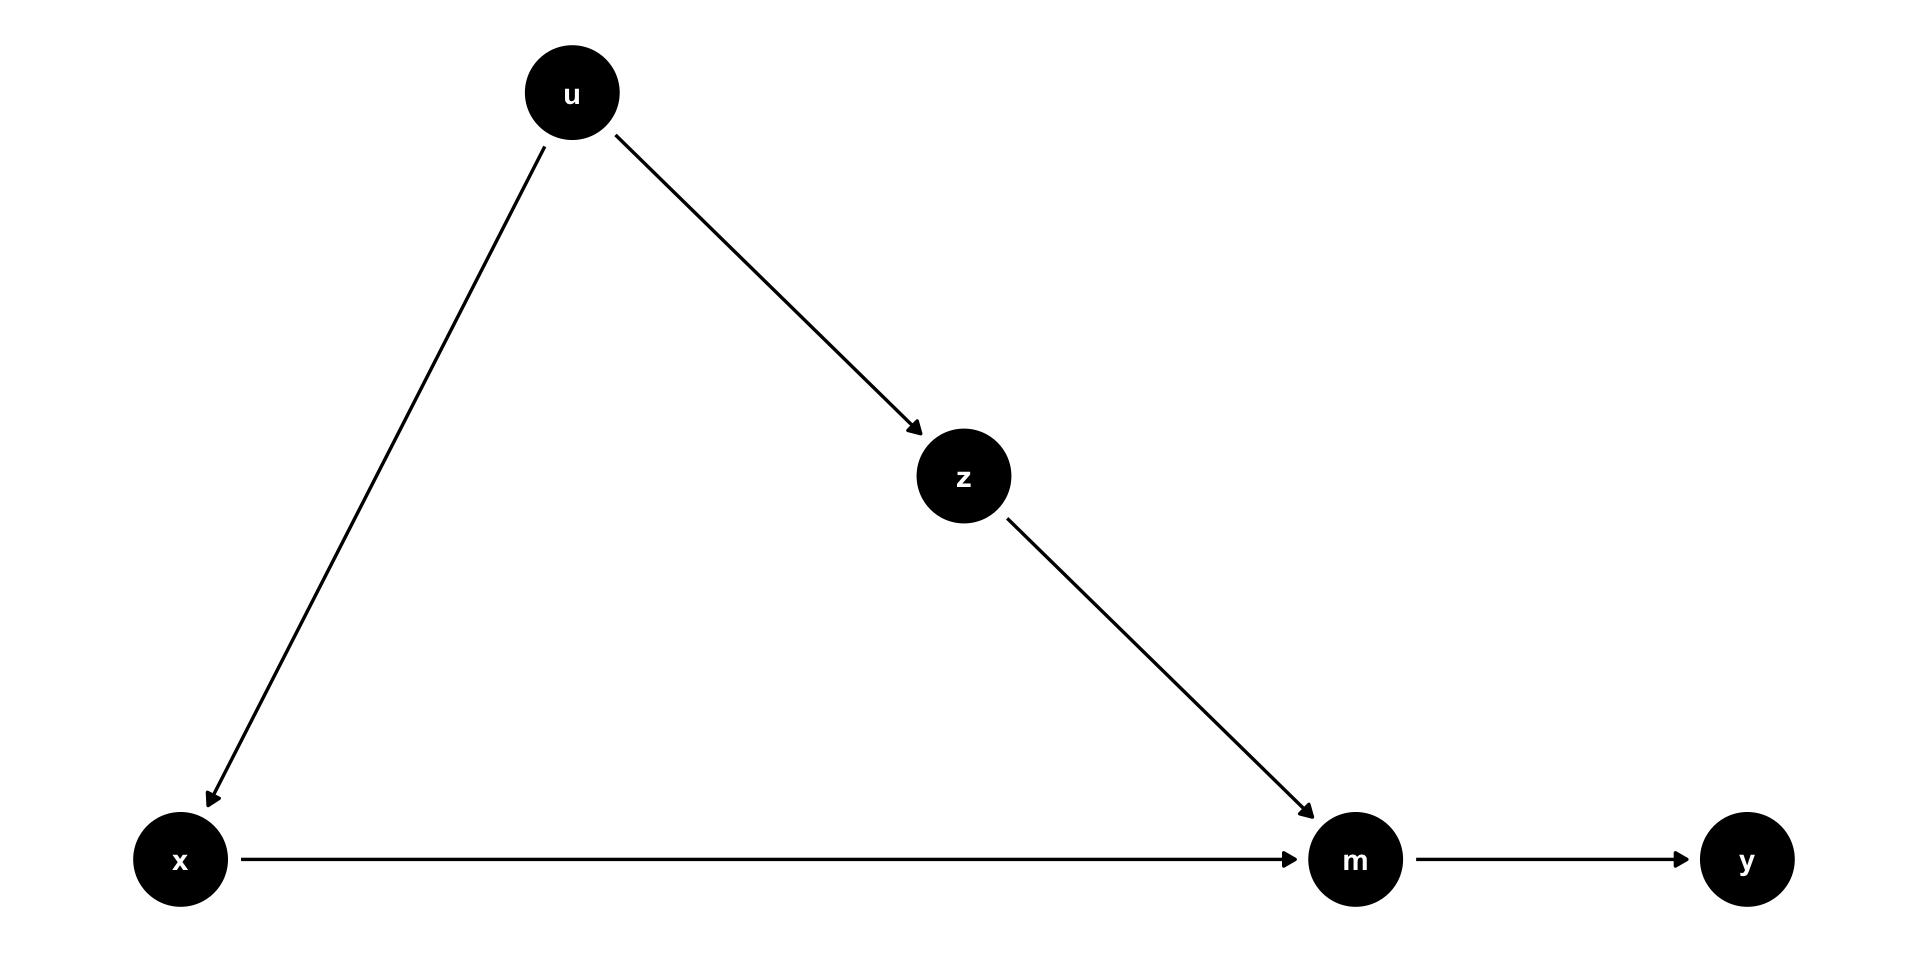
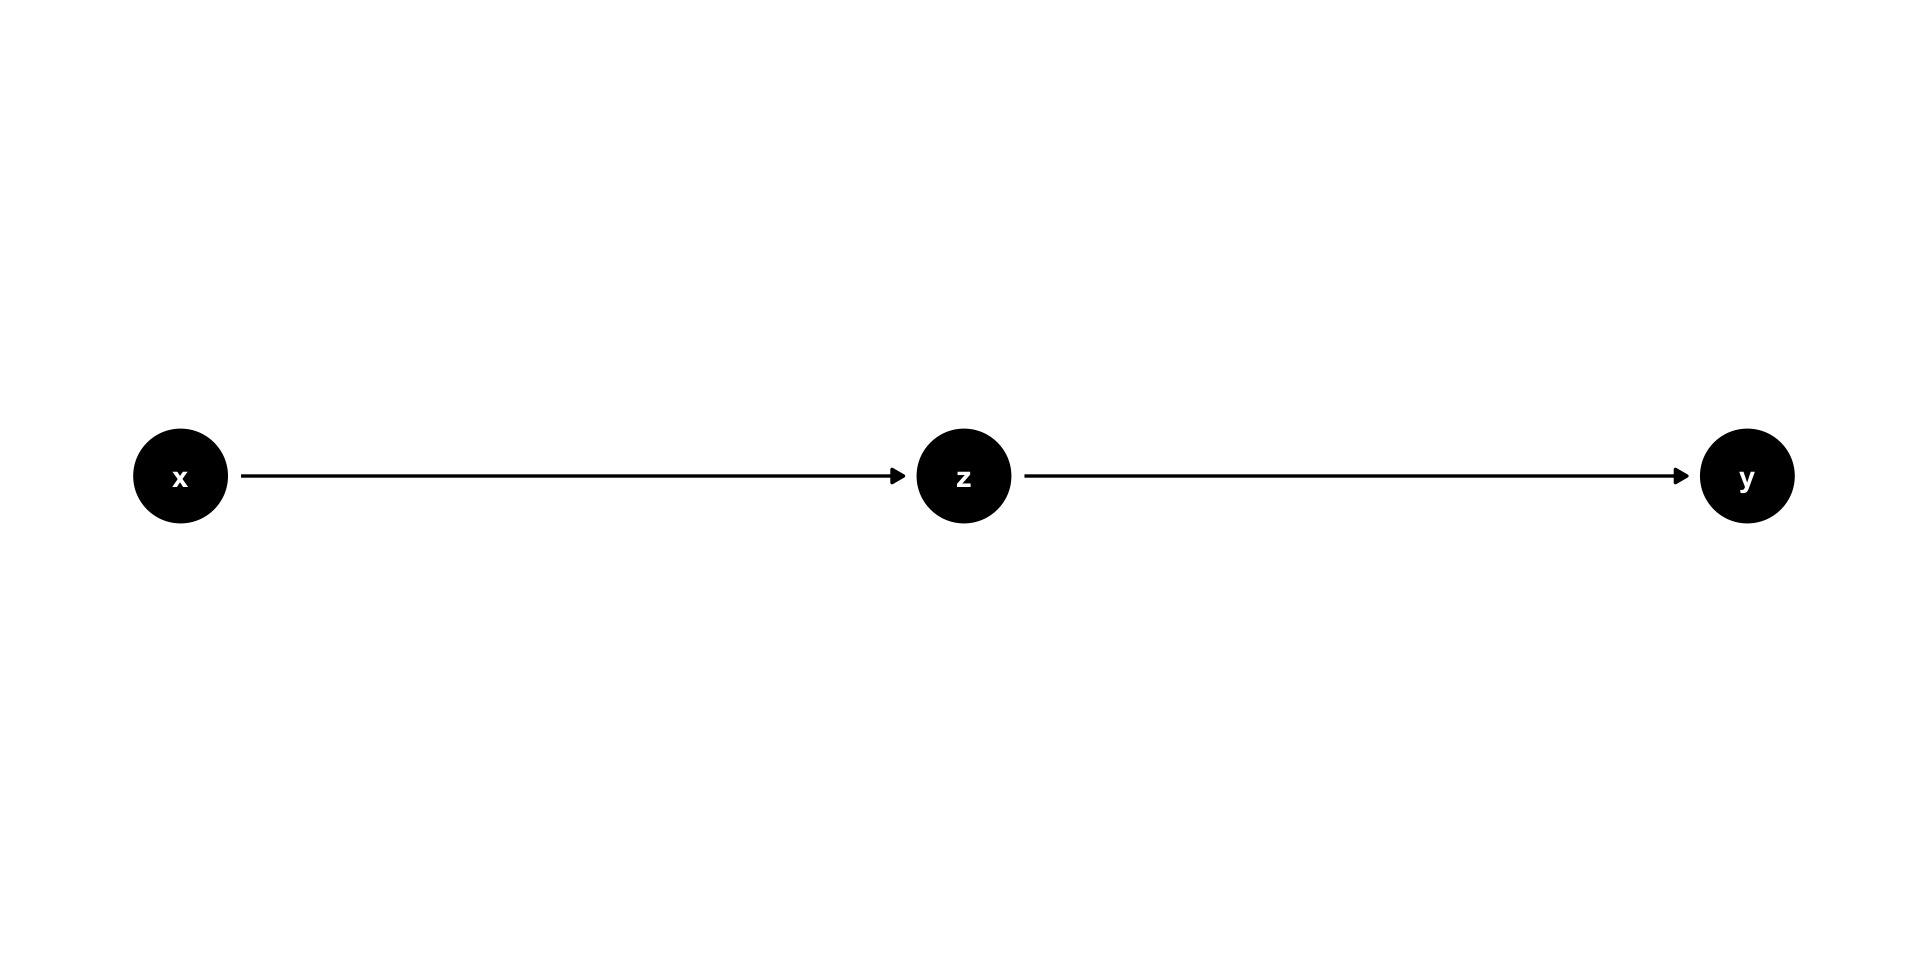
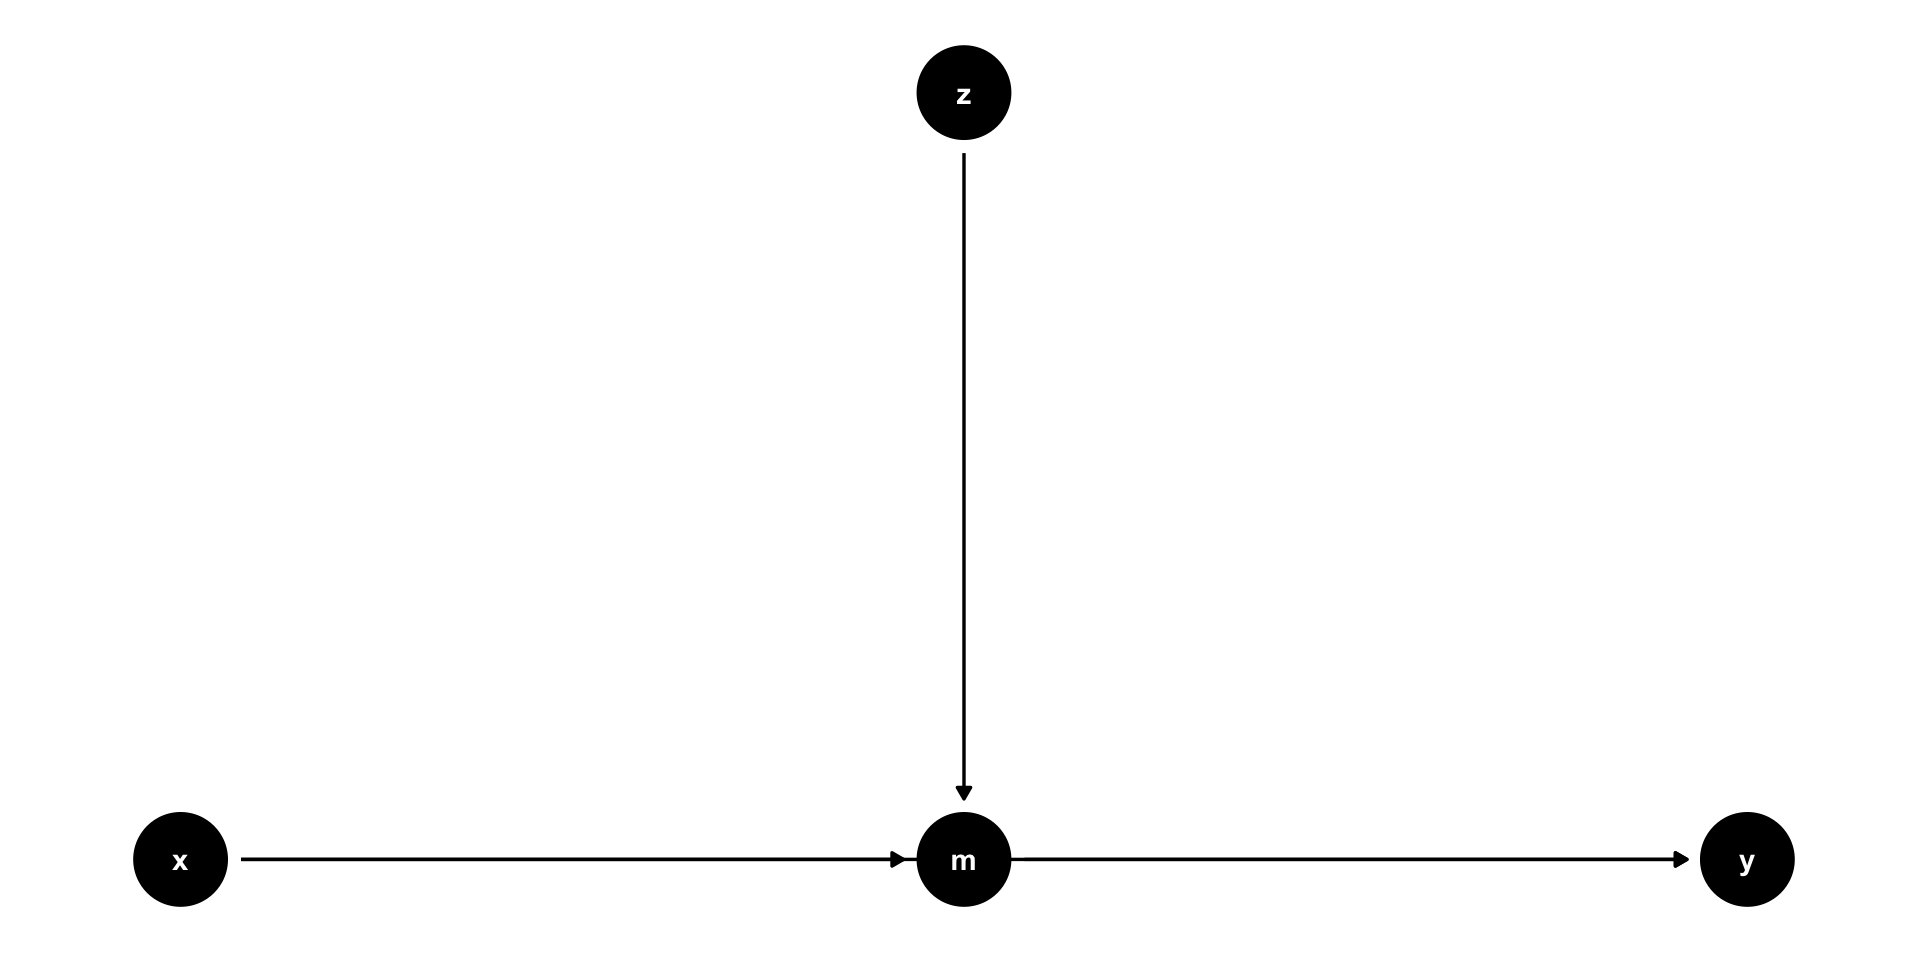
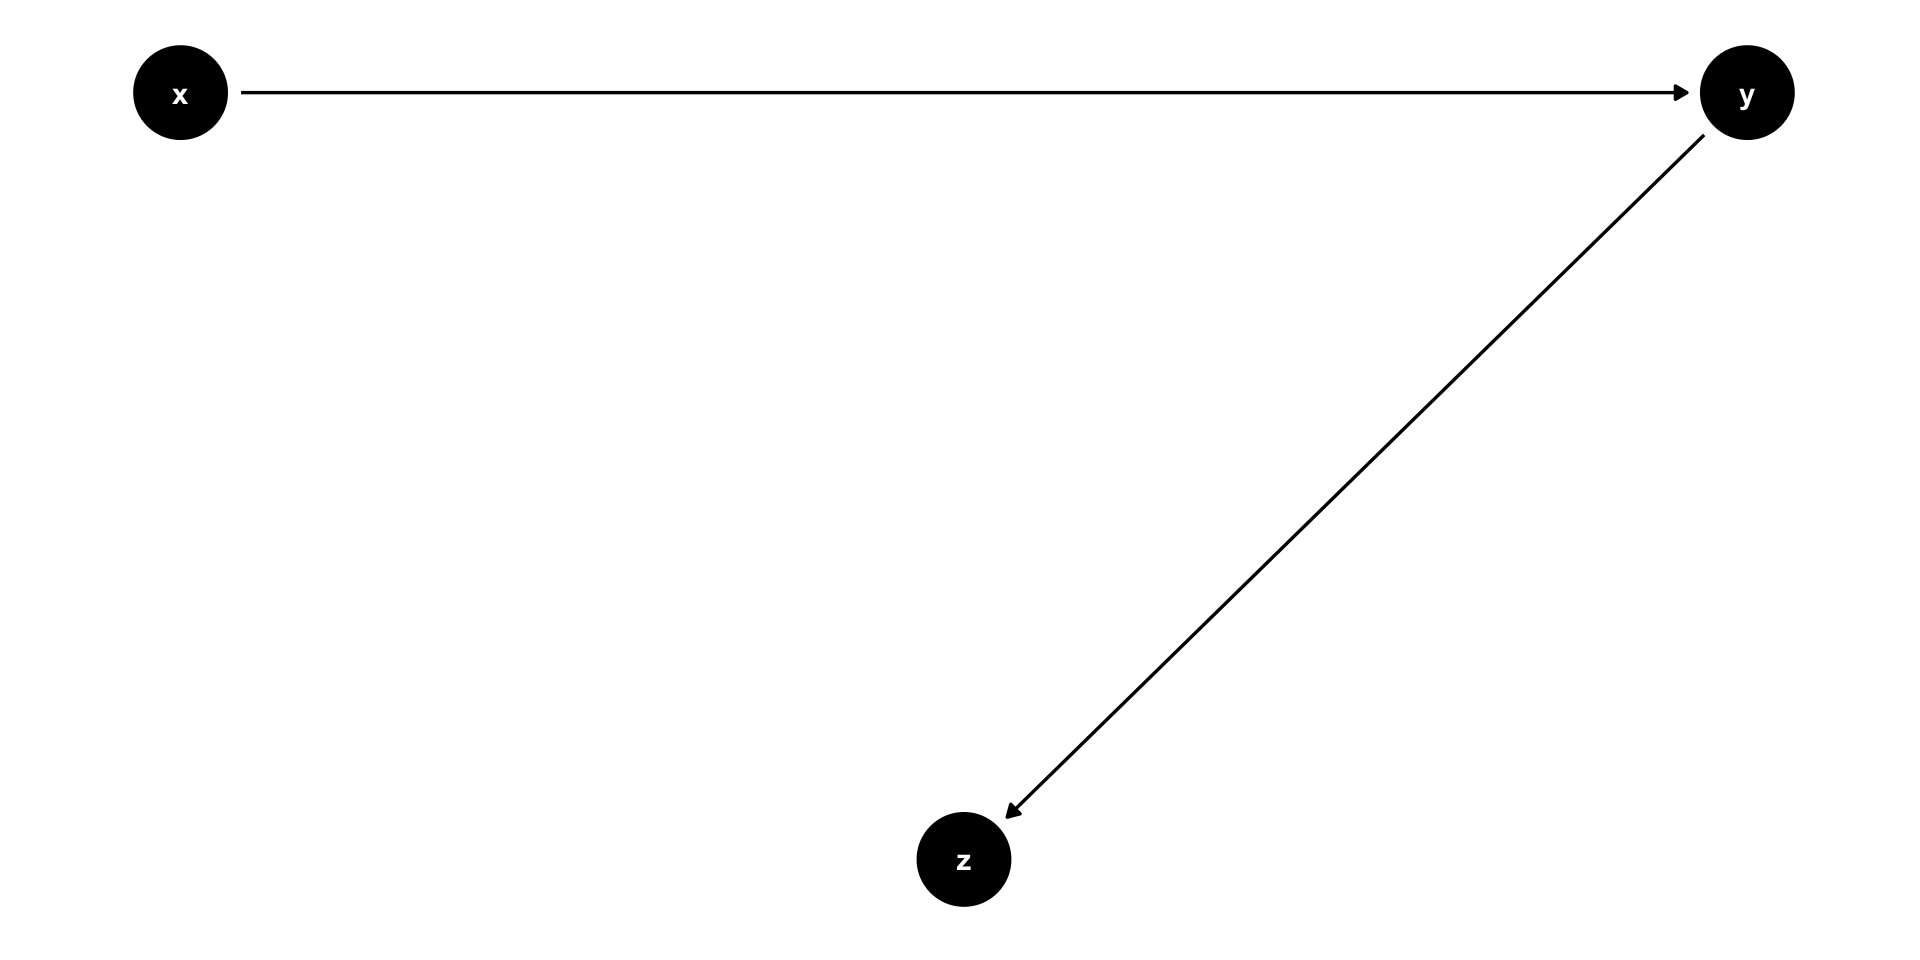
model3 graph
model3 simulation
| (1) | (2) | |
|---|---|---|
| (Intercept) | −0.032 | −0.024 |
| (0.016) | (0.010) | |
| x | 1.496 | 1.006 |
| (0.011) | (0.008) | |
| z | 0.992 | |
| (0.008) | ||
| Num.Obs. | 10000 | 10000 |
| R2 | 0.640 | 0.855 |
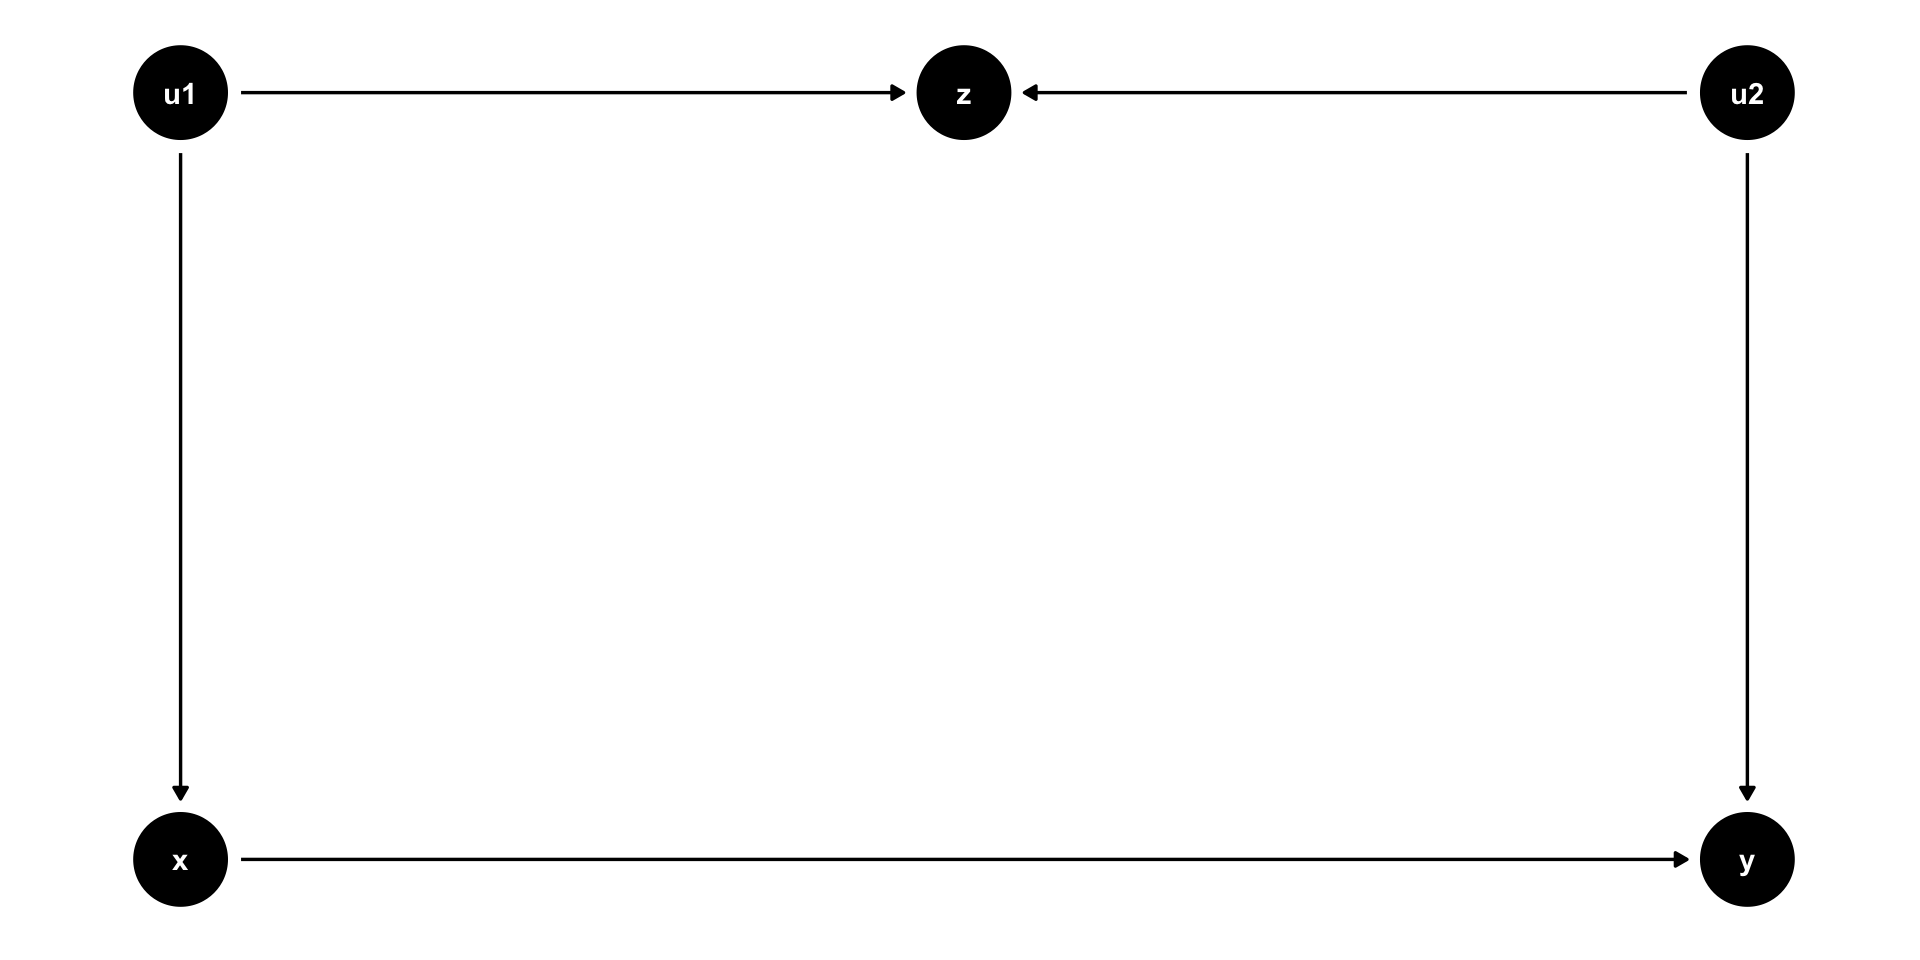
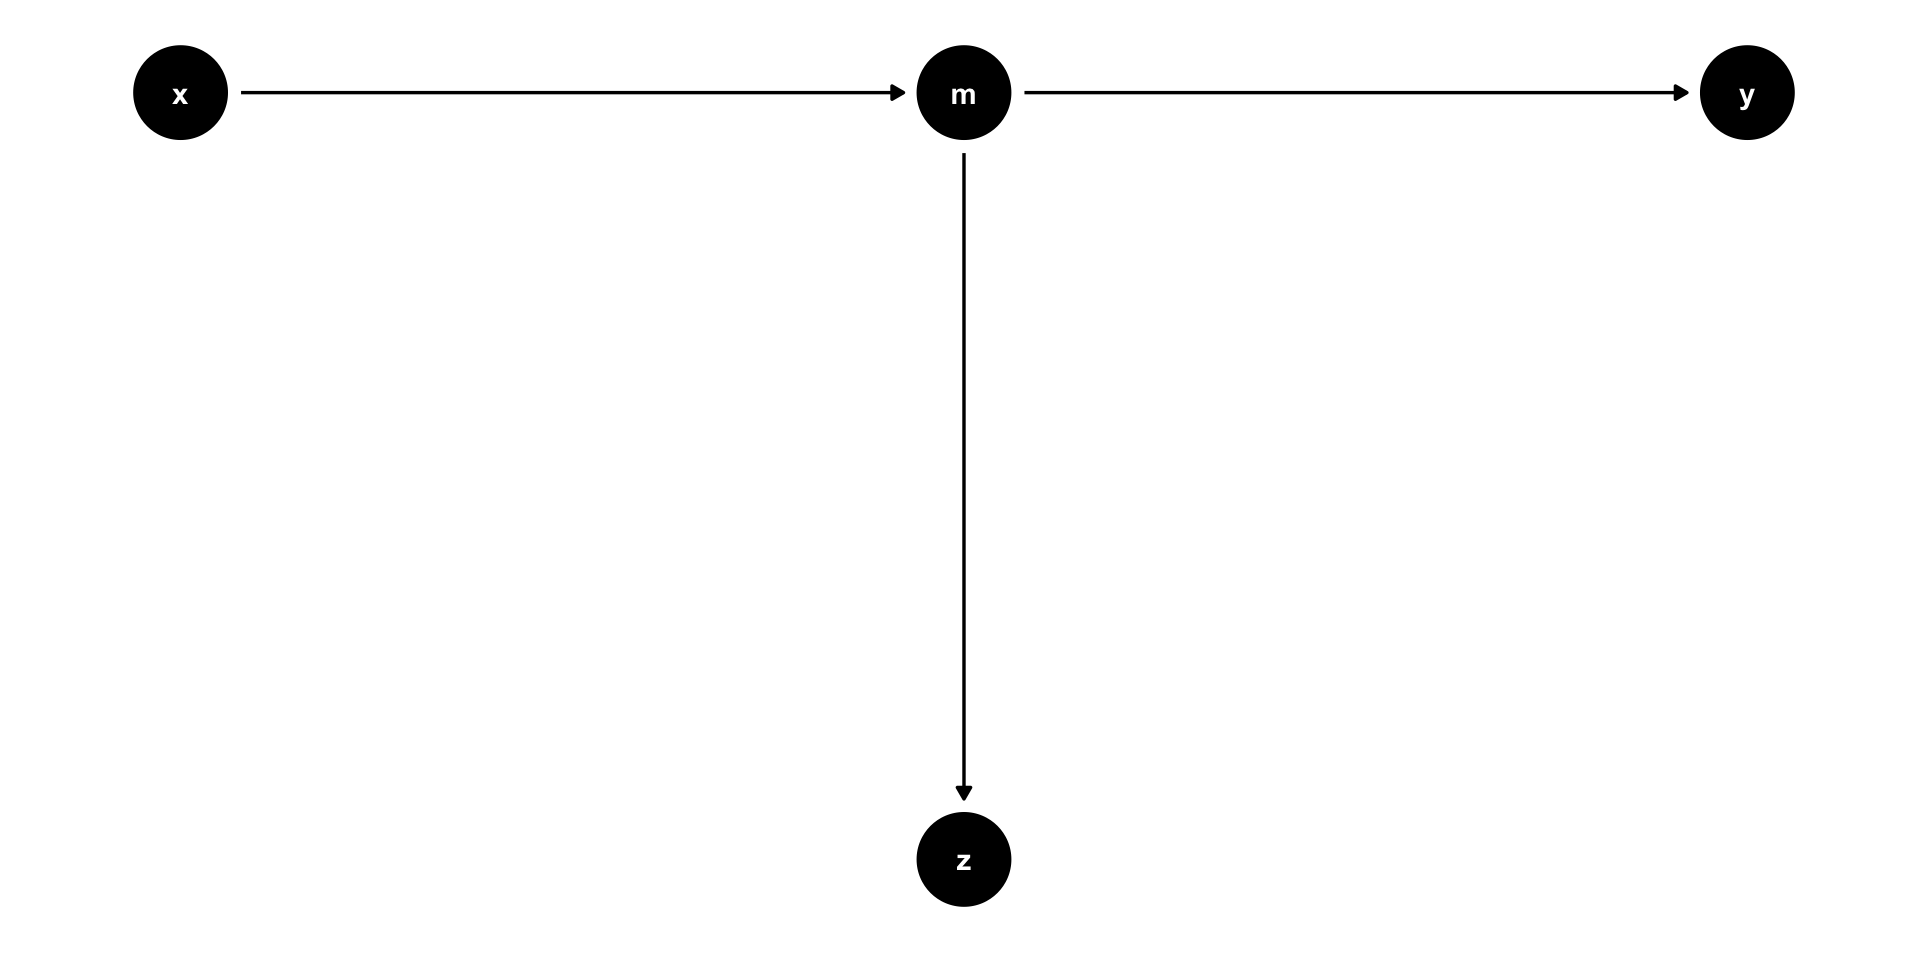
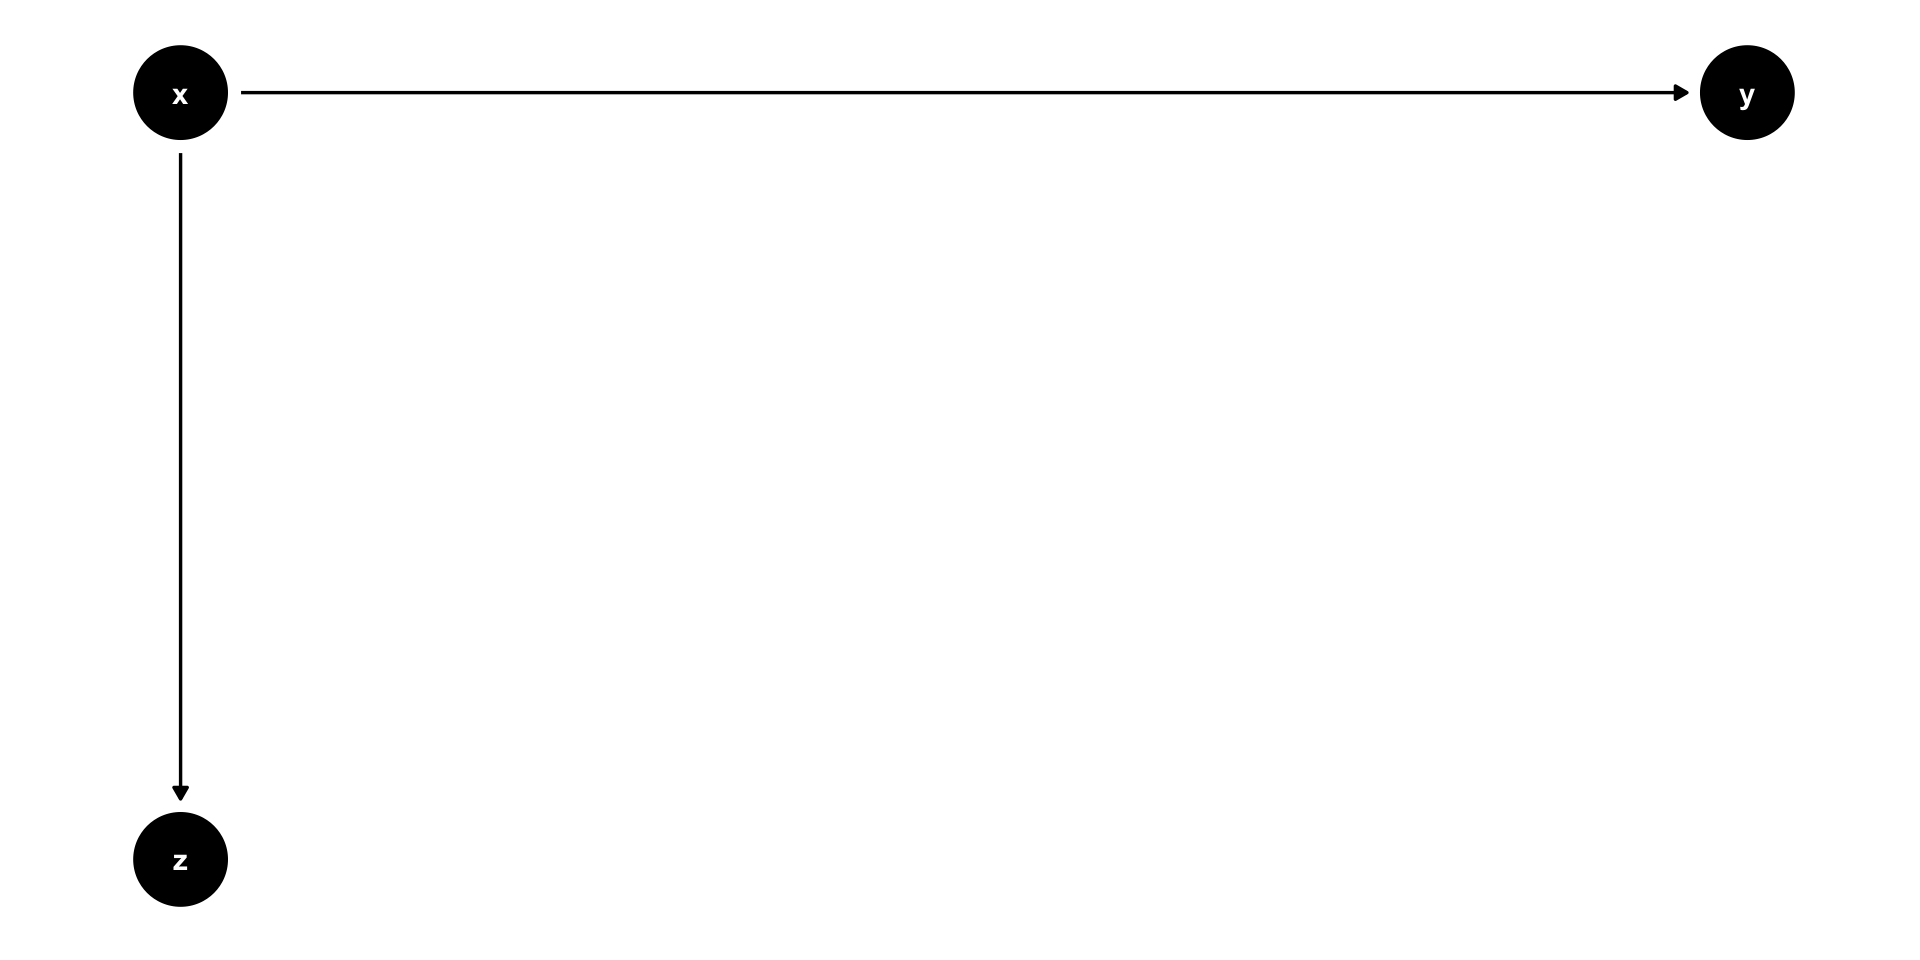
model4 graph
model4 simulation
| (1) | (2) | |
|---|---|---|
| (Intercept) | 0.018 | 0.011 |
| (0.016) | (0.014) | |
| x | 1.484 | 0.977 |
| (0.011) | (0.014) | |
| z | 1.011 | |
| (0.020) | ||
| Num.Obs. | 10000 | 10000 |
| R2 | 0.638 | 0.713 |
model5 graph
model5 simulation
| (1) | (2) | |
|---|---|---|
| (Intercept) | −0.021 | −0.014 |
| (0.017) | (0.016) | |
| x | 1.320 | 0.972 |
| (0.010) | (0.016) | |
| z | 0.521 | |
| (0.019) | ||
| Num.Obs. | 10000 | 10000 |
| R2 | 0.656 | 0.680 |
model6 graph
model6 simulation
| (1) | (2) | |
|---|---|---|
| (Intercept) | 0.006 | −0.004 |
| (0.019) | (0.014) | |
| x | 1.519 | 1.012 |
| (0.013) | (0.012) | |
| z | 1.001 | |
| (0.012) | ||
| Num.Obs. | 10000 | 10000 |
| R2 | 0.563 | 0.749 |
model7 graph
mdoel7 simulation
| (1) | (2) | |
|---|---|---|
| (Intercept) | 0.075 | 0.084 |
| (0.041) | (0.032) | |
| x | 0.984 | 1.748 |
| (0.029) | (0.025) | |
| z | −1.580 | |
| (0.020) | ||
| Num.Obs. | 10000 | 10000 |
| R2 | 0.102 | 0.437 |
model8 graph
model8 simulation
unadjusted.x   adjusted.x
    1.000071     1.000279
model9 graph
model 9 simulation
unadjusted.x   adjusted.x
    1.000293     1.000552
model10 graph

model10 simulation
| (1) | (2) | |
|---|---|---|
| (Intercept) | 0.024 | 0.012 |
| (0.021) | (0.017) | |
| x | 1.339 | 2.003 |
| (0.009) | (0.012) | |
| z | −1.987 | |
| (0.030) | ||
| Num.Obs. | 10000 | 10000 |
| R2 | 0.712 | 0.801 |
model11 graph
model11 simulation
| (1) | (2) | |
|---|---|---|
| (Intercept) | −0.020 | −0.020 |
| (0.014) | (0.010) | |
| x | 1.023 | 0.032 |
| (0.014) | (0.014) | |
| z | 0.977 | |
| (0.010) | ||
| Num.Obs. | 10000 | 10000 |
| R2 | 0.346 | 0.670 |
model12 graph
model12 simulation
| (1) | (2) | |
|---|---|---|
| (Intercept) | 0.007 | 0.001 |
| (0.014) | (0.012) | |
| x | 1.024 | 0.496 |
| (0.014) | (0.015) | |
| z | 0.514 | |
| (0.009) | ||
| Num.Obs. | 10000 | 10000 |
| R2 | 0.344 | 0.517 |
variation of model11
variation of model11 simulation
| (1) | (2) | |
|---|---|---|
| (Intercept) | 0.001 | −0.004 |
| (0.024) | (0.012) | |
| x | 1.013 | −0.496 |
| (0.024) | (0.015) | |
| z | 1.503 | |
| (0.009) | ||
| Num.Obs. | 10000 | 10000 |
| R2 | 0.148 | 0.782 |
model13 graph
model13 simulation
unadjusted.x   adjusted.x
    1.000018     1.000700
model14 graph
model14 simulation
unadjusted.x   adjusted.x
    1.001285     1.001036
model15 graph
model15 simulation
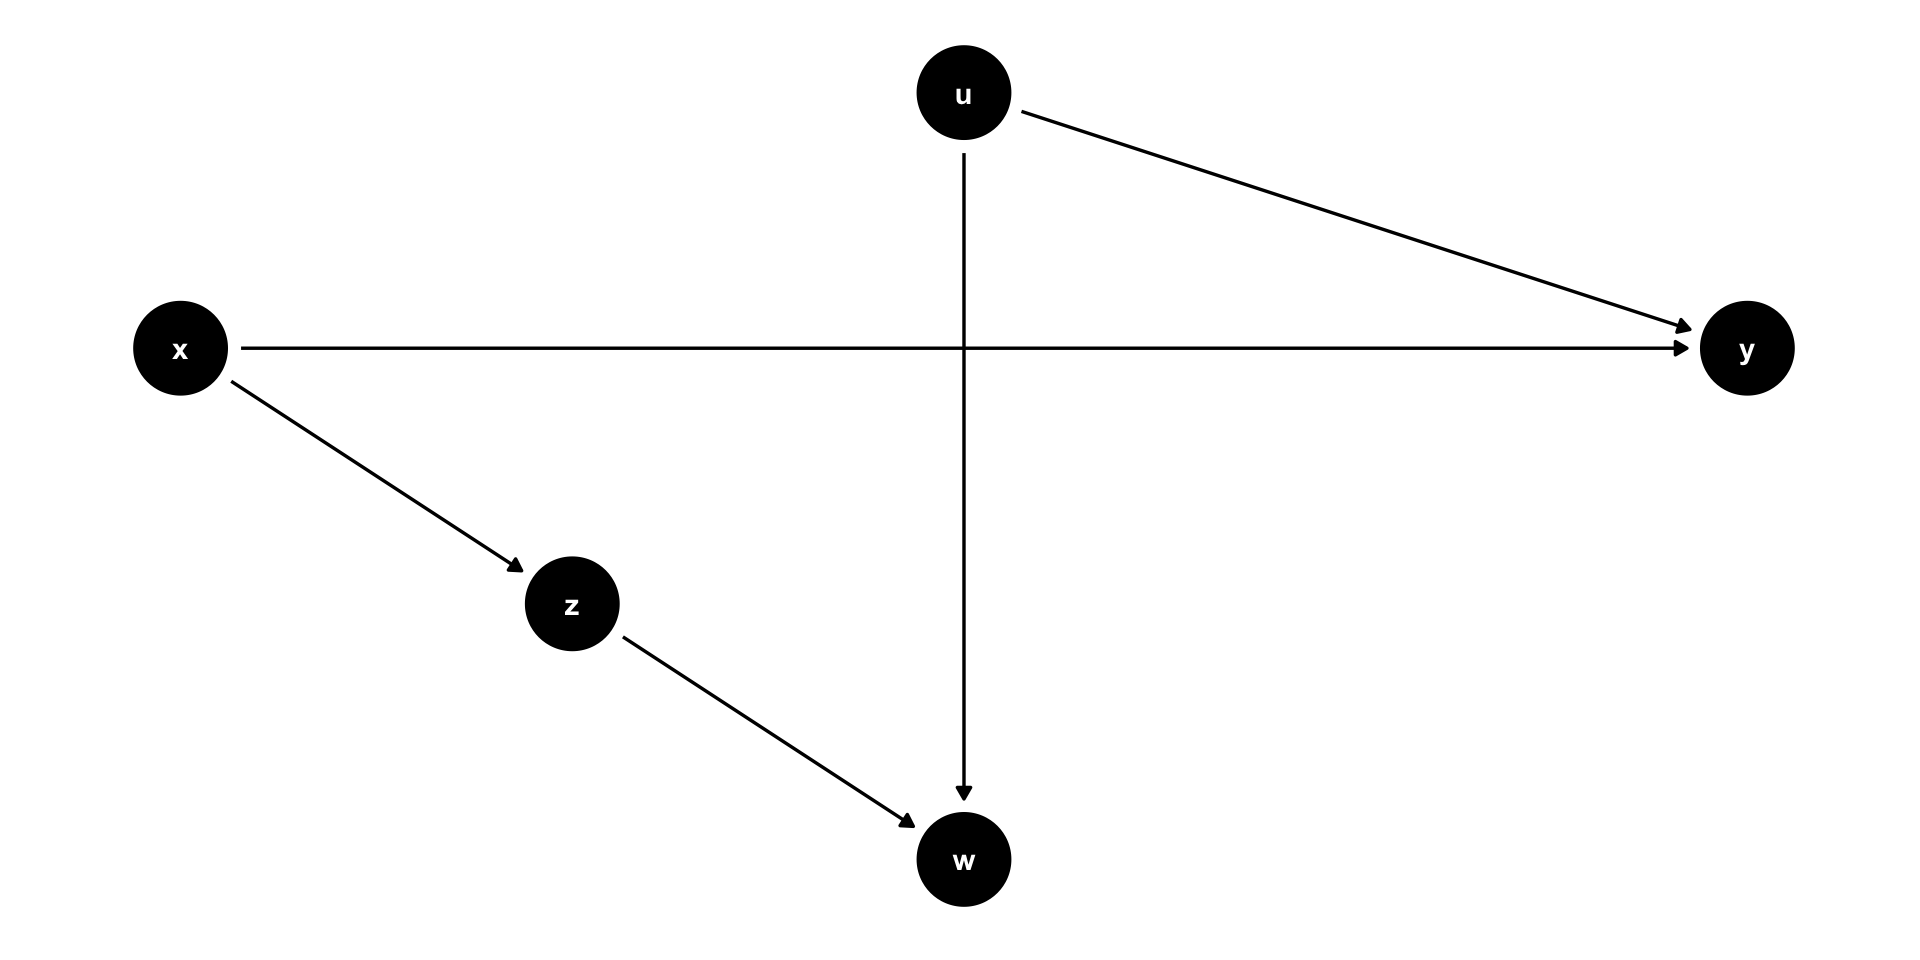
| (1) | (2) | (3) | |
|---|---|---|---|
| (Intercept) | 0.016 | 0.015 | 0.014 |
| (0.019) | (0.017) | (0.022) | |
| x | 1.642 | 0.990 | 0.993 |
| (0.022) | (0.024) | (0.022) | |
| w | −0.656 | −0.995 | |
| (0.011) | (0.012) | ||
| z | 1.000 | ||
| (0.021) | |||
| Num.Obs. | 10000 | 10000 | 10000 |
| R2 | 0.383 | 0.498 | 0.165 |
model16 graph
model16 simulation
| (1) | (2) | |
|---|---|---|
| (Intercept) | 0.032 | 0.020 |
| (0.023) | (0.017) | |
| x | 1.013 | −0.019 |
| (0.023) | (0.021) | |
| z | 1.021 | |
| (0.012) | ||
| Num.Obs. | 10000 | 10000 |
| R2 | 0.164 | 0.511 |
model17 graph
model17 simulation
| (1) | (2) | |
|---|---|---|
| (Intercept) | 0.007 | −0.003 |
| (0.010) | (0.007) | |
| x | 1.008 | 0.010 |
| (0.010) | (0.012) | |
| z | 0.494 | |
| (0.005) | ||
| Num.Obs. | 10000 | 10000 |
| R2 | 0.511 | 0.755 |
model18 graph
model18 simulation
| (1) | (2) | |
|---|---|---|
| (Intercept) | −0.001 | 0.003 |
| (0.010) | (0.007) | |
| x | 0.978 | 0.496 |
| (0.010) | (0.009) | |
| z | 0.497 | |
| (0.005) | ||
| Num.Obs. | 10000 | 10000 |
| R2 | 0.489 | 0.743 |
summary